Market Recap for Monday, April 3, 2017
It was a rough day on Wall Street to open the month of April, but an afternoon rally did minimize any damage technically. The Russell 2000, the recent leader among our major indices, was trampled and lost 1.17%, while the Dow Jones rally fell just shy of the breakeven point. I find strong relative performance in small caps to be a signal of higher prices ahead, but the relative downtrend of the Russell 2000 vs. the benchmark S&P 500 was again being tested and thus far it's failed. Check this out:
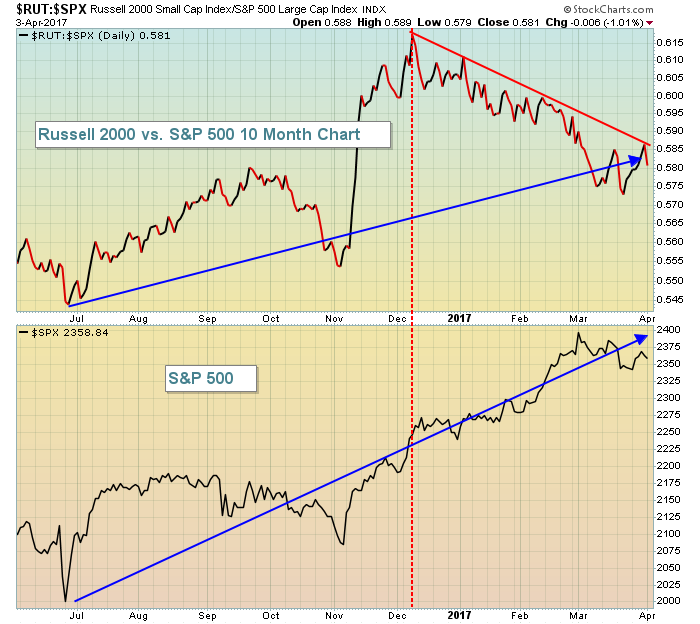 Taking a big picture approach, both the S&P 500 and the RUT:SPX ratio have climbed off the post-Brexit lows - a bullish signal. But the shorter-term action has not been nearly as bullish. The red-dotted vertical line shows that since December the S&P 500 has continued to rise while money has rotated away from small caps. That's a bearish sign that I'd like to see change. The first step is to break that relative downtrend line (red downsloping line).
Leadership on Monday came from the healthcare sector (XLV, +0.08%), which was the only sector to finish in positive territory. Consumer discretionary (XLY, -0.40%) was the worst performing sector, but the space did see strength in automobiles ($DJUSAU) to open April. That's significant because April is by far the best calendar month for automobiles as illustrated in the Historical Tendencies section below. Tesla (TSLA) was the primary reason for the strength in autos as TSLA has made a major long-term breakout:
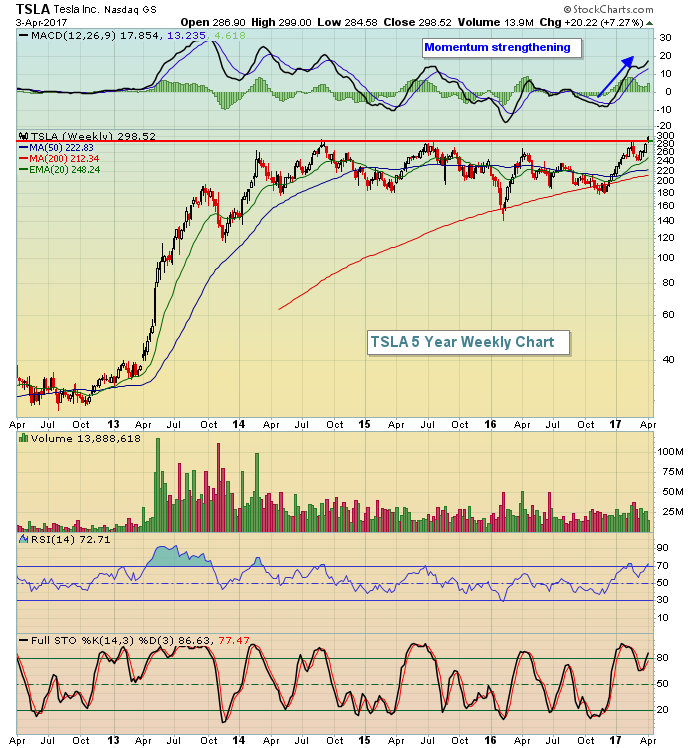 After consolidating since the high in mid-2014, TSLA has recently pressed higher and just broke to all-time highs. Volume of more than 13 million on Monday is confirming this breakout and I look for higher prices ahead for TSLA.
Pre-Market Action
Gold ($GOLD) is on the rise this morning, back above $1260 as it closes in on significant short-term price resistance near 1265. At last check, $GOLD was at 1261 in pre-market trade. The dollar ($USD) has been on the rise over the past week after testing major price support at 99. Something has to give here as the dollar and gold rarely move in the same direction for very long.
The 10 year treasury yield ($TNX) is down again this morning with the TNX closing in on 2.30% yield support. The TNX is down 2 basis points this morning to 2.33%.
Dow Jones futures are pointing to a lower open, down 54 points 30 minutes from the opening bell.
Current Outlook
The 10 year treasury yield ($TNX) continues its descent. Since the Fed announcement, it's been a steady plunge as investors have decided to move back into the more defensive treasuries. Higher treasury prices mean lower yields as there's an inverse relationship between the two. The TNX remains in a very bullish pattern, despite the March downtrend as you can see below:
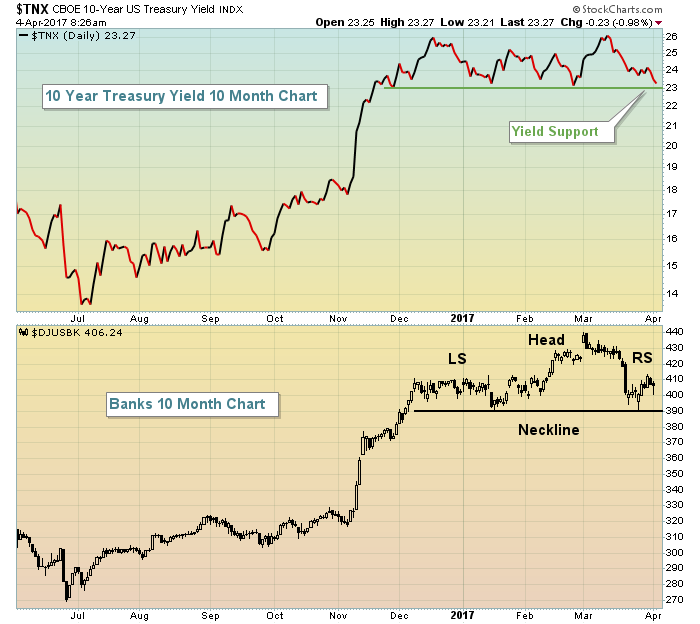 The TNX rose sharply from November through mid-December, then consolidated in sideways fashion, a bullish continuation pattern. But in order to maintain this bullish pattern, 2.30% yield support needs to hold. Banks ($DJUSBK) tend to grow their profits rapidly in a rising interest rate environment and I remain bullish the group for now. However, I'm not ignoring the potential topping head & shoulders pattern that's developed after reaching a high on March 1st. A breakdown beneath yield support at 2.30% and DJUSBK price support/neckline at 390 would be a bearish development for U.S. equities.
Sector/Industry Watch
Over the past month, the three worst performing industry groups within the industrials sector are airlines ($DJUSAR, -7.01%), truckers ($DJUSTK, -5.47%) and railroads ($DJUSRR, -4.80%). It's never a good sign to see transportation stocks ($TRAN) weak as it's a sign of potential economic weakness ahead. In particular, the truckers are threatening to lose 20 week EMA support despite strong momentum. That could create a further drop to test price support as reflected below:
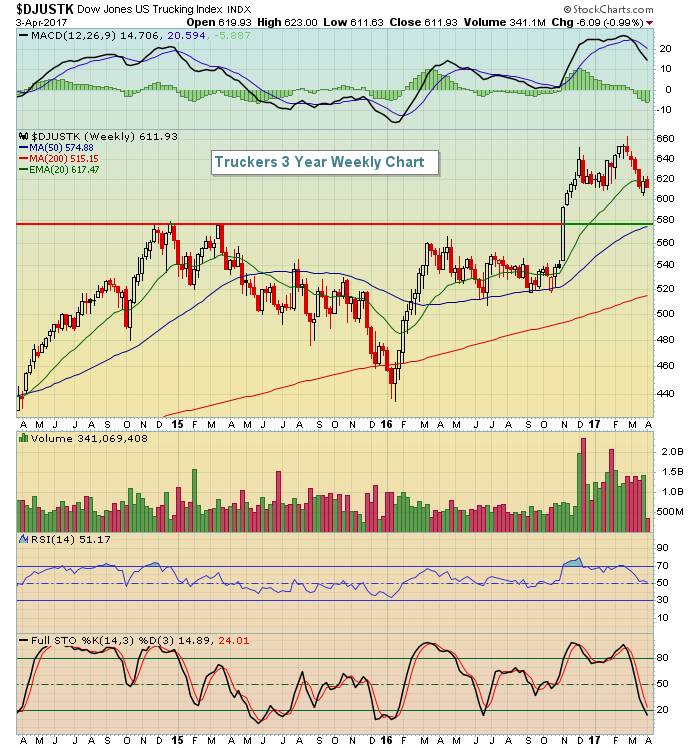 A drop below 600 would quite likely send the DJUSTK down to test price support near 580 and the rising 50 week SMA, currently at 575.
Historical Tendencies
Automobiles ($DJUSAU) are perhaps the strangest industry group in terms of historical performance. Autos overall have mostly languished over the years with little appreciation. To illustrate, Ford (F) traded close to 23.00 to open this century. It closed yesterday at 11.44. But what's amazing is that despite this overall poor performance throughout the years and clear underperformance relative to the benchmark S&P 500, April is an awesome month in terms of auto performance. Check out this seasonal chart:
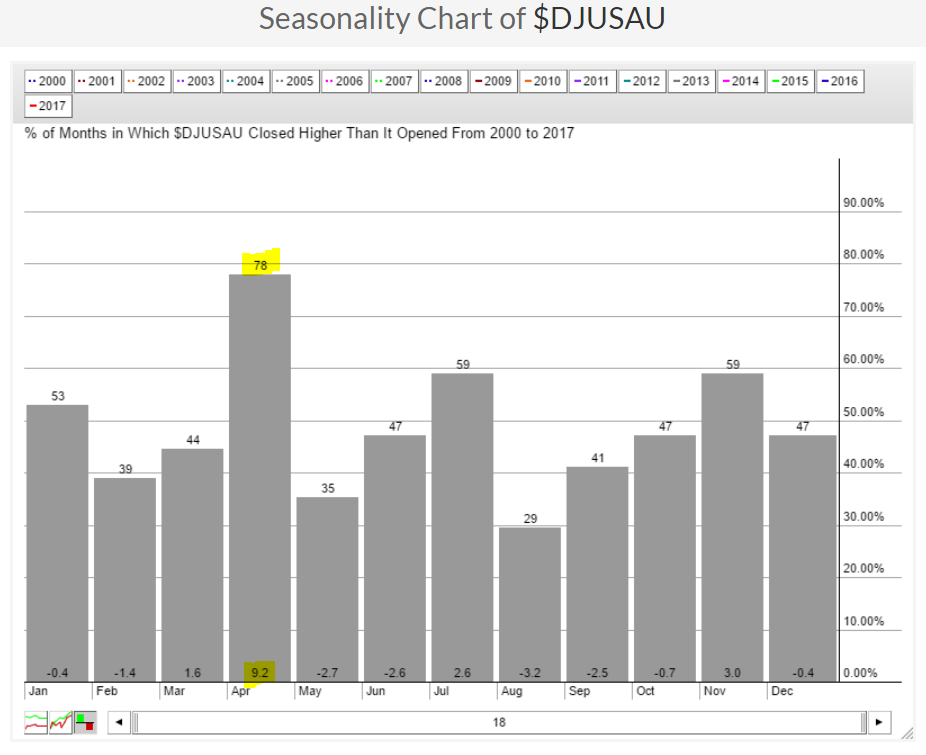 Over the past 18 years, the DJUSAU has actually produced average monthly losses in 8 of the 12 calendar months. April, however, clearly stands out as the major exception, rising 78% of Aprils since the turn of the century and producing average April returns of 9.2%. This would appear to be another reason to consider TSLA on the long side as we move into April.
Key Earnings Reports
(actual vs. estimate):
AYI: 1.70 (estimate - haven't seen actual yet)
Key Economic Reports
February factory orders to be released at 10:00am EST: +1.0% (estimate)
Happy trading!
Tom
