Market Recap for Friday, May 26, 2017
Friday's action was slightly bullish overall, but there was little difference between the best performing sectors and the worst performing sectors. Consumer stocks performed well with consumer staples (XLP, +0.37%) and consumer discretionary (XLY, +0.30%) leading all sectors. On the flip side, slight weakness was found in healthcare (XLV, -0.18%) as pharmas ($DJUSPR) and biotechs ($DJUSBT) were weak.
The Dow Jones finally followed the NASDAQ and S&P 500 to a record high close on Thursday and tried to do it again Friday before finishing with a two point loss. The biggest problem for the Dow Jones is that its weekly breakout comes with an ugly negative divergence in play. While we certainly could see higher prices near-term, these negative divergences can pose problems further out and with the more bearish summer months approaching, it's time to at least be somewhat cautious. Here's the weekly chart:
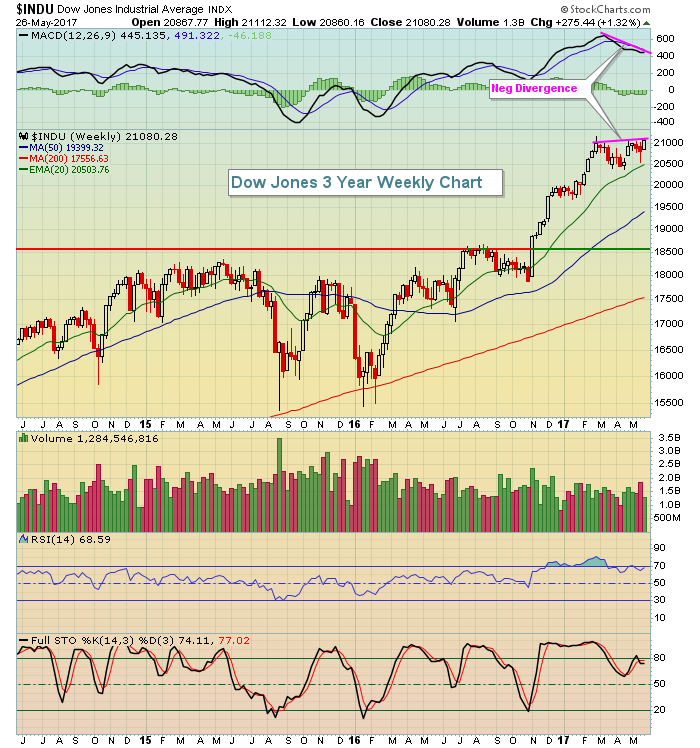 Price support close to 18500 could be tested this summer - it's not out of the question.
Pre-Market Action
As we begin a fresh trading week, the Dow Jones is showing slight losses in its futures, down 23 points at last check.
Gold ($GOLD) and crude oil prices ($WTIC) are down 0.55% and 0.74%, respectively, this morning. Global indices are mixed, though most major global markets remain in longer-term bullish uptrends.
Current Outlook
The 10 year treasury yield ($TNX) continues to give us no clear cut signs of which way the bond market believes our economy is heading. I'd still give the edge to the bulls as the TNX has sideways consolidated for the past several months after a surge higher during November and the first half of December. Here's the bullish setup:
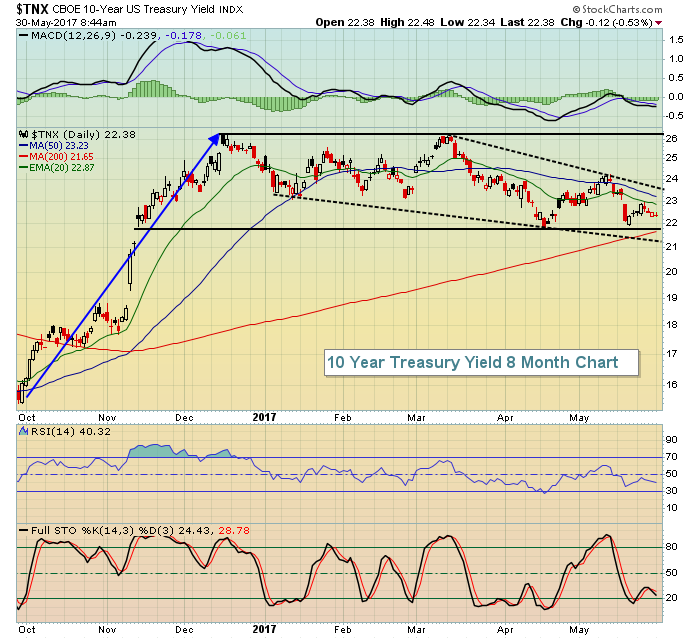 The blue directional line highlights the obvious uptrend in yields from late-2016. The solid black lines depict a bullish rectangular consolidation, while the black dotted lines show a possible bullish wedge. There are no guarantees we'll see a breakout to confirm these two potential bullish patterns, but I would expect there's a much higher probability of a breakout as opposed to a breakdown and Fed officials continue their rhetoric of higher rates to come.
Sector/Industry Watch
The Dow Jones U.S. Brewers Index ($DJUSDB) is beginning to look like a bottom has formed. On a daily chart (not pictured below), the latest gap lower appears to be an exhaustion gap and that would set up well on the weekly chart, as shown below:
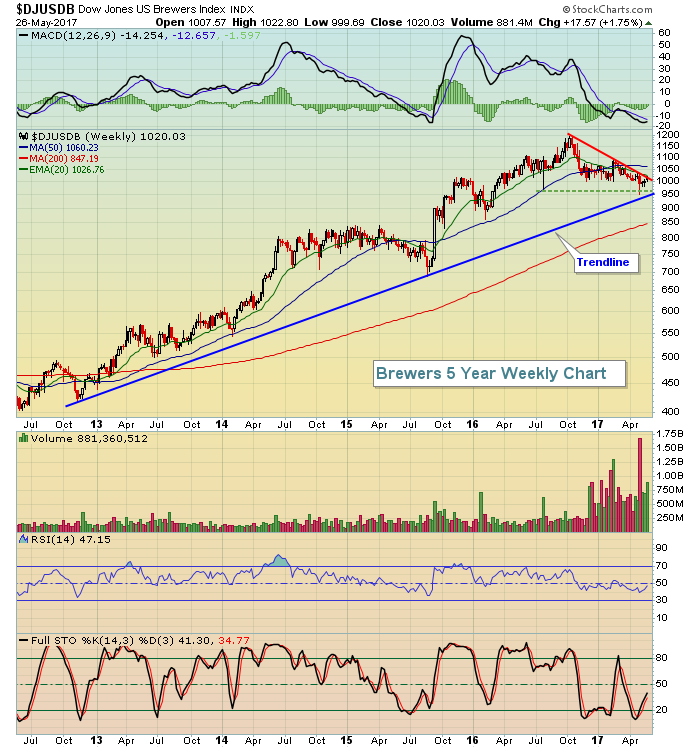 The short-term downtrend line is being tested currently while the recent selling down to the 950 level tested a much more significant uptrend line that's held for several years. 950 is HUGE price and trendline support so be careful if that level is violated. In the meantime, I'd be bullish the group and look for a breakout of that short-term downtrend line.
Monday Setups
Bloomin' Brands (BLMN) printed a negative divergence in mid-May and needed to work off that slowing momentum issue, which it did with last week's 50 day SMA test. That also tested a key price support level as its MACD has now returned to centerline support for a "reset". I'd expect to see another push back to 22.00 while 19.75 should offer up price support. Here's the chart:
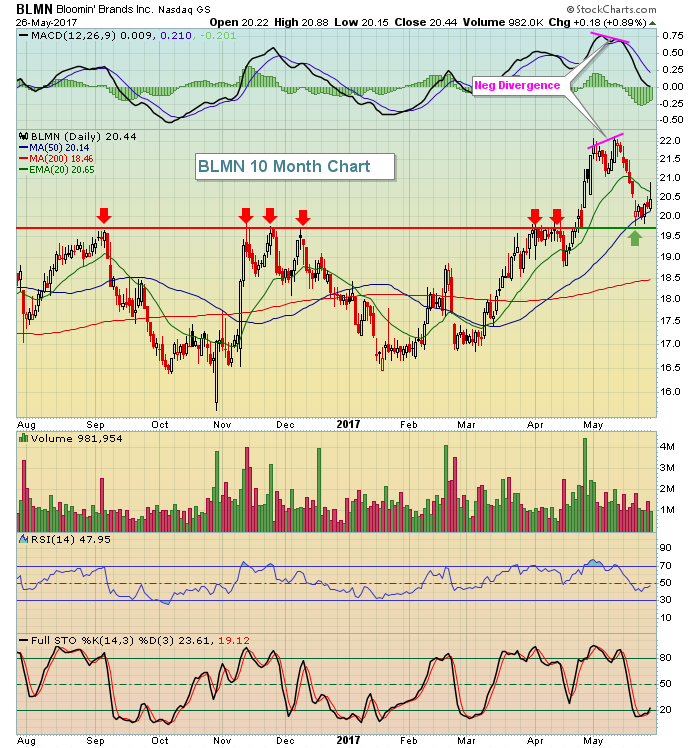 Another dip beneath 20.00 would represent the best short-term price entry point for a trade.
Historical Tendencies
The market may or may not go up this week, but it'll certainly be enjoying historical tailwinds. Since 1971 on the NASDAQ, here are the following annualized returns by calendar day of the month:
May 30 (today): +35.81%
May 31 (Wednesday): +15.50%
June 1 (Thursday): +60.51%
June 2 (Friday): +106.81%
June 5 (next Monday): +89.70%
Key Earnings Reports
(actual vs. estimate):
BNS: 1.23 vs 1.14
Key Economic Reports
April personal income released at 8:30am EST: +0.4% (actual) vs. +0.4% (estimate)
April personal spending released at 8:30am EST: +0.4% (actual) vs. +0.4% (estimate)
March Case-Shiller home price index to be released at 9:00am EST: +0.8% (estimate)
May consumer confidence to be released at 10:00am EST: 119.0 (estimate)
Happy trading!
Tom
