Market Recap for Tuesday, May 23, 2017
Eight of nine sectors finished in positive territory on Tuesday as only consumer discretionary (XLY, -0.38%) failed to do so. 18 of 23 industry groups within the discretionary sector finished lower, with retail and home construction stocks clearly the weakest links. After gapping higher initially on a strong quarterly earnings report from Toll Brothers (TOL), the home construction index ($DJUSHB) tumbled following a disappointing April new home sales report that was released at 10am EST. The selling continued throughout the session. However, the good news is that I expect to see short-term selling only down to test rising 20 day EMA support as momentum remains quite strong on the daily chart. Here's the visual:
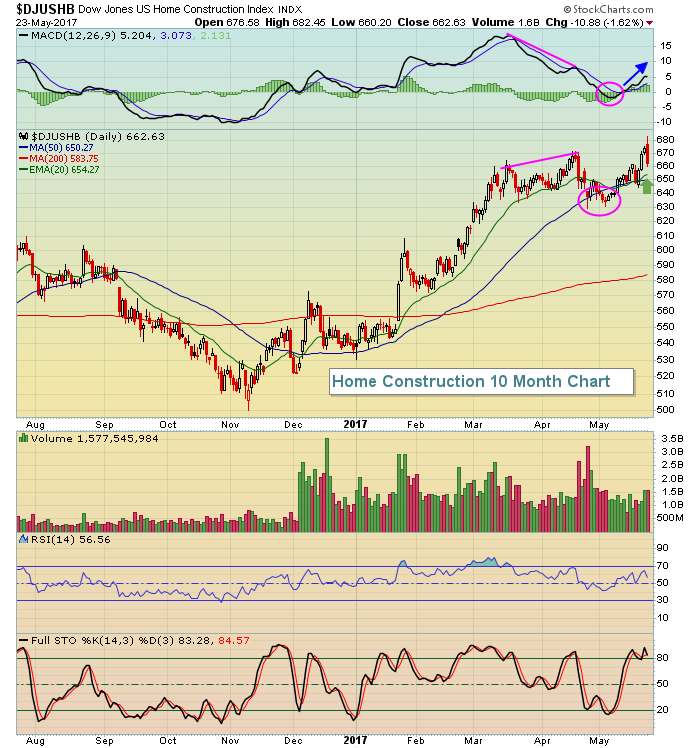 The pink annotations show the negative divergence that formed on the April high and the subsequent MACD centerline test to reset the MACD and the 50 day SMA test. Now the group again appears to be building momentum as the rising MACD from centerline support shows.
Meanwhile, financials (XLF, +0.77%) easily led Tuesday's market action as banks ($DJUSBK) continued to rally off very significant price support (potential neckline in a topping head & shoulders pattern). Check this out:
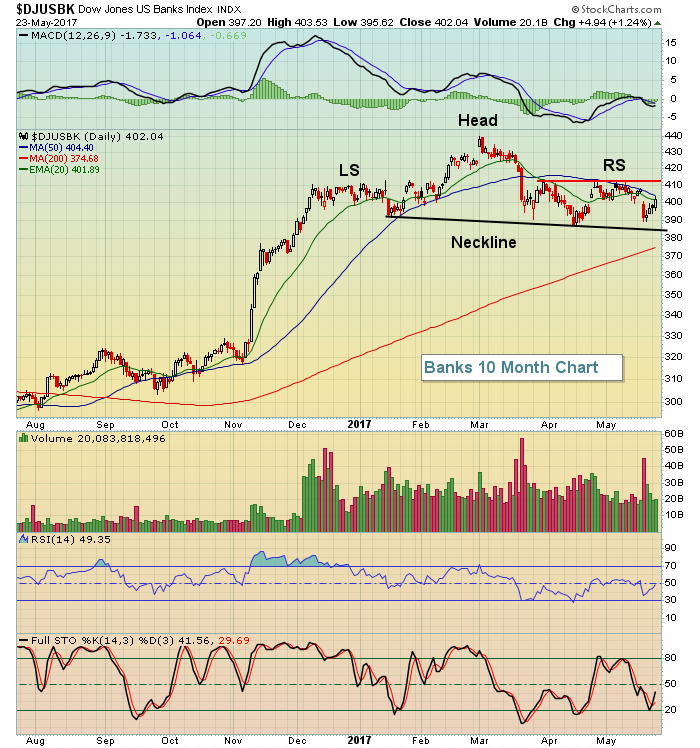 385 marks critical price support while a break above the 410-415 range would negate this bearish pattern in my view.
Pre-Market Action
Dow Jones futures have turned slightly higher, up 9 points, with 30 minutes left to the opening bell. This is on the heels of mostly higher action overnight in Asia, while European markets are mixed this morning. The 10 year treasury yield ($TNX), a key driver for financials on Tuesday as it rose to 2.28%, is down slightly in early trading this morning.
Gold is down this morning, adding to losses felt on Tuesday. The dollar (UUP) finally reversed on Tuesday and that strength could pose issues for gold in the near-term.
Current Outlook
The Russell 2000 ($RUT) is at an interesting point on its chart as it battles short-term price and trendline resistance. A definitive close above 1380-1385 is what I'm looking for to move the technical picture into a more bullish pattern. Check out this two month 60 minute chart:
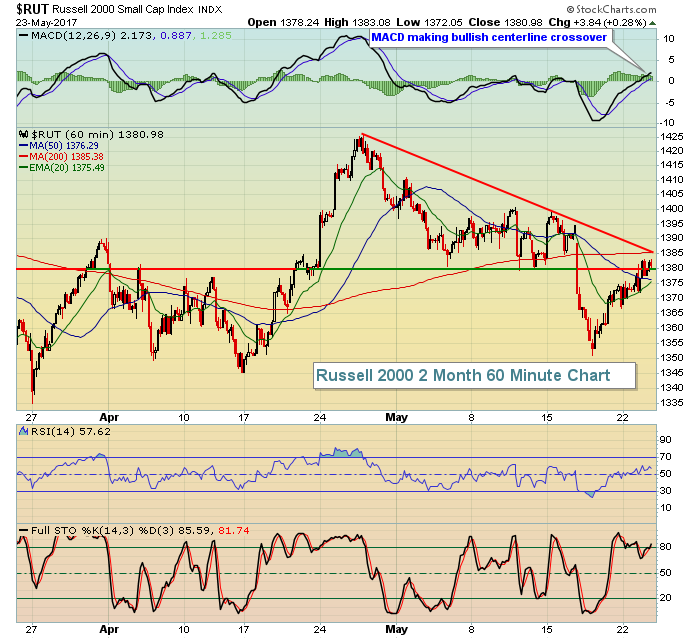 We are heading into the month of June - the calendar month that ends the outperformance of small caps (vs. the benchmark S&P 500). We are also entering a very bullish historical period for small caps (similar to the NASDAQ whose seasonal outperformance is detailed below in the Historical Tendencies section). Since 1987, the Russell 2000 has produced annualized returns of +64.59% from May 26th (Friday) through June 5th. Therefore, historical tailwinds could also lift small caps if the technical breakout above 1380-1385 occurs.
Sector/Industry Watch
The Dow Jones U.S. Electronic Equipment Index ($DJUSAI) had a strong day Tuesday and has been a solid performer over the past year. It has, however, had difficulties on a couple occasions after printing negative divergences on its MACD. These divergences occur when prices continue to move higher, while the daily MACD (difference between the short-term 12 day EMA and longer-term 26 day EMA) begins to drop. It's a signal of slowing momentum and many times leads to more significant selling and consolidation. You can see below that the DJUSAI has had a couple of steeper drops (pink directional lines on the price chart) after such negative divergences have formed:
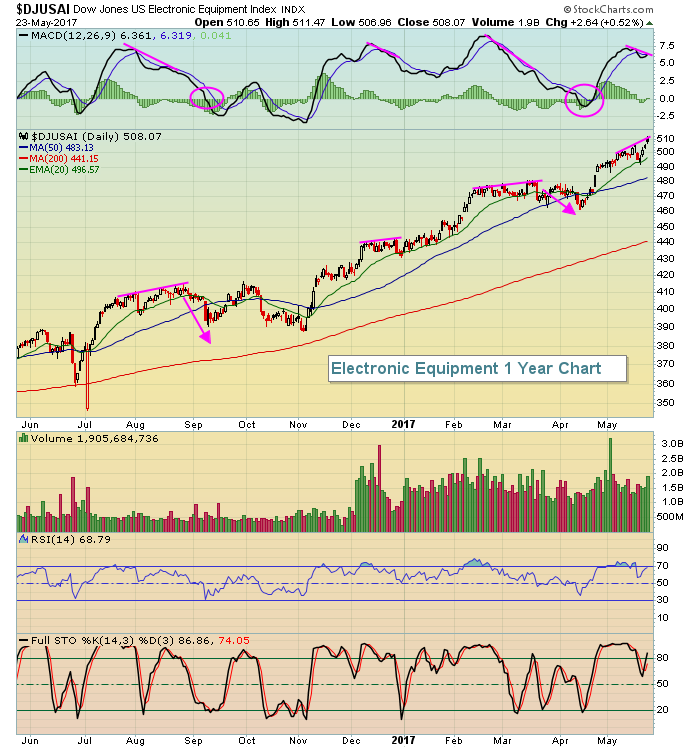 Exercise caution in this space as the DJUSAI is also moving into overbought territory with its negative divergence present. Of course there are never any guarantees. The late December high on this index was accompanied by a negative divergence, but prices continued rising and never looked back. Consider technical analysis as a means to help minimize risk, not as a means to guarantee a specific result.
Historical Tendencies
May 26th (Friday) begins a very bullish historical period on the NASDAQ that runs through June 5th. The annualized return for this period since 1971 is +49.70%.
Key Earnings Reports
(actual vs. estimate):
AAP: 1.60 vs 2.12
BMO: 1.45 vs 1.40
ETP: .09 vs .14
LOW: 1.03 vs 1.07
TIF: .74 vs .70
(reports after close, estimate provided):
CPRT: .36
HPQ: .39
NTAP: .68
PVH: 1.60
UHAL: 1.99
Key Economic Reports
March FHFA house price index to be released at 9:00am EST: +0.5% (estimate)
April existing home sales to be released at 10:00am EST: 5,650,000 (estimate)
Happy trading!
Tom
