Market Recap for Monday, June 26, 2017
The Volatility Index ($VIX) is a signal of what the market expects in terms of volatility over the near-term (1 to 2 months). While some look at the current reading below 10 as a signal of extreme complacency that will result in a lot of selling ahead, I don't view it that way at all. I believe low VIX readings tell us that the market can handle bad news without batting an eye. Perhaps we'll see knee-jerk reactions and short-term selling, but that will only set up short-term buying opportunities. If you study the stock market's history, you'll find that bear markets begin when the VIX is elevated and market participants are more fearful. That's where significant price damage can occur. Right now, the VIX is near recent lows and I think tells us to keep our money on the long side. Check out the current reading:
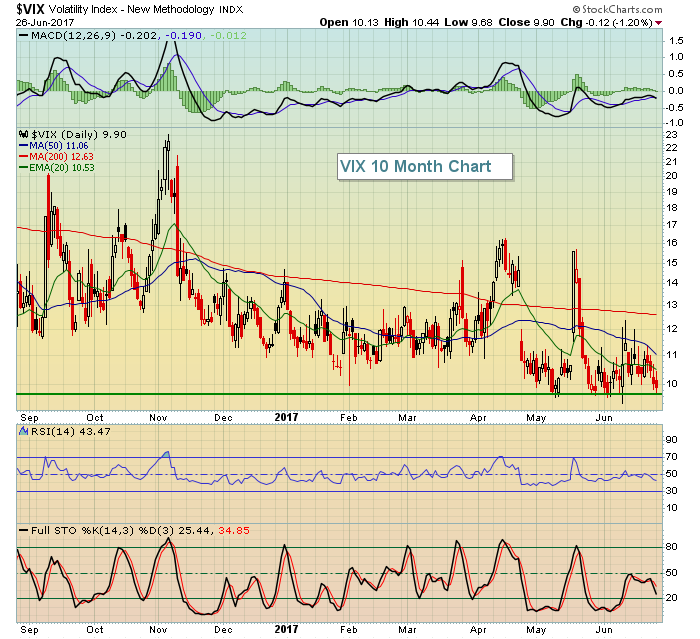 The last two bear markets have begun with VIX readings above the 16-17 level and NEVER during those bear markets did the VIX fall below 16-17. A bear market now with the VIX below 10 makes no sense whatsoever. The environment is not set up for a bear market. That can change fairly quickly (within months), but it's not set up that way right now.
So the rotation continues.
Utilities (XLU, +0.68%) and financials (XLF, +0.54%) were the leaders, while technology stocks (XLK, -0.53%) stumbled. Internet stocks ($DJUSNS) continue to struggle after a very nice ride higher in 2017 and this group is featured in the Sector/Industry Watch section below.
Pre-Market Action
Crude oil ($WTIC) is continuing its recent winning streak and nearing $44 per barrel - just a few days after holding onto price support closer to $42 per barrel. Asian markets were mixed overnight, while European markets are mostly lower this morning. The German DAX ($DAX) is down 0.63% at last check, which would mark its first close beneath its rising 20 day EMA if conditions don't improve into the close.
Currently, Dow Jones futures are slightly lower - down 11 points - with roughly 30 minutes left to the opening bell.
Current Outlook
While both the daily charts and weekly charts of the S&P 500 show negative divergences that could spell summertime trouble (consolidation with bouts of selling), those technical issues really can't begin to take shape until short-term breakdowns occur. Therefore, as a trader, I'd focus on a couple of key short-term levels on the S&P 500:
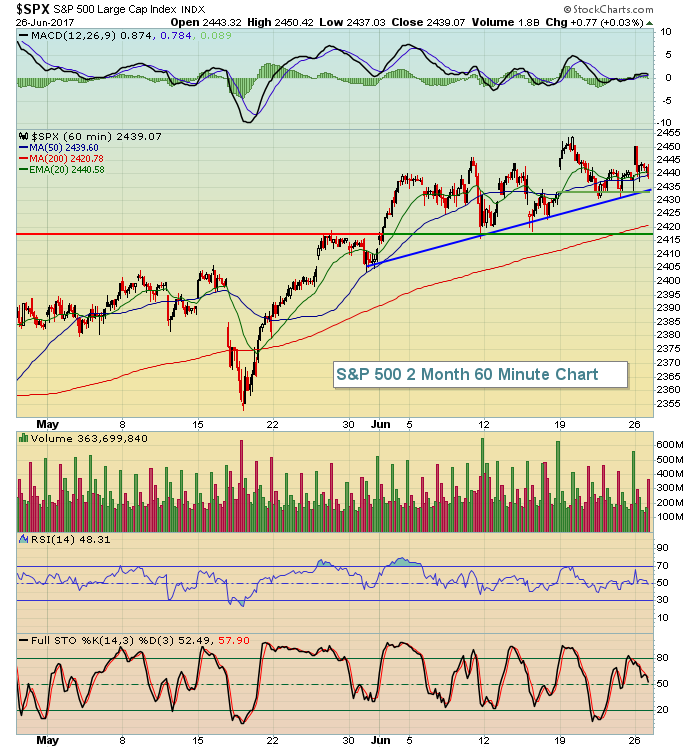 The above two month intraday chart shows a nice established uptrend line that currently intersects the 2435 area. Keep in mind that trendlines are very subjective and can move depending on whether you're connecting tails or candlebodies. I typically connect the latter. There's also gap support at 2433 that's held, though it has been successfully tested once already. Beneath that is the TA 101 price support/resistance line closer to 2417. Should all three of these support levels vanish, then we could begin to see a more significant period of selling that could include the more bearish summer months of August and September.
Sector/Industry Watch
The Dow Jones U.S. Internet Index ($DJUSNS) had a rough day on Monday and it's begun to show a lot of wear and tear of late after tripling in less than five years. The group is still quite strong and bullish, but a lengthy period of consolidation, starting now, cannot be ruled out. This industry has gained more than 30% since the low in November. So how far back might it drop?
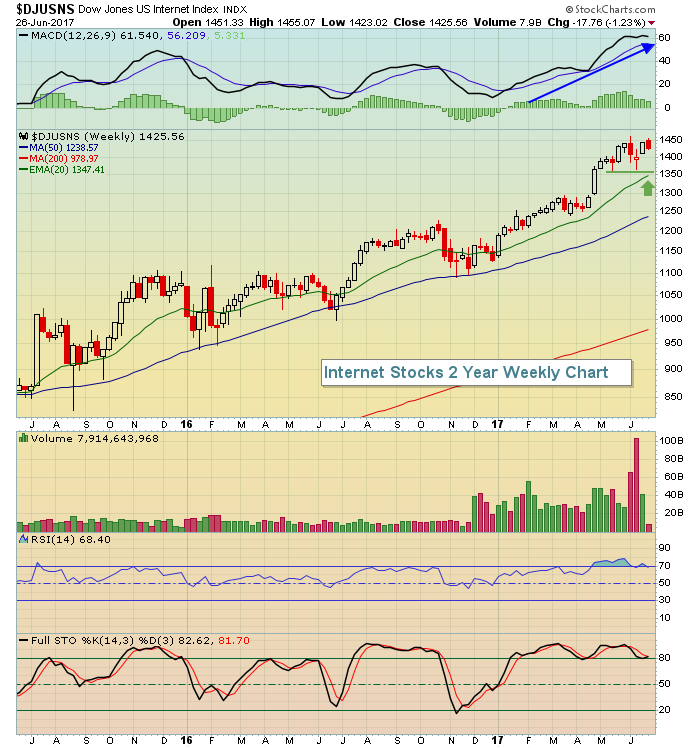 Take a look at the weekly RSI. It's been above 70 for much of the past 8-9 weeks. It's finally beginning to see a bit of relief and could use some more. A weekly RSI in the 40s is not uncommon as it's happened multiple times in just the past two years. I'm not expecting internet stocks to fall apart, I'm really just looking for a period of consolidation that starts initially with a test of short-term price support near 1360. That would also provide us a test of the rising 50 day SMA for the first time in 2017. I fully expect, at this time, for other areas of the market to absorb any selling of technology stocks as they have in recent weeks.
Historical Tendencies
Internet stocks also face historical headwinds the next couple months. Only January and February have produced more seasonal troubles for the DJUSNS than July and August. Here's the historical summary over the past 17 years:
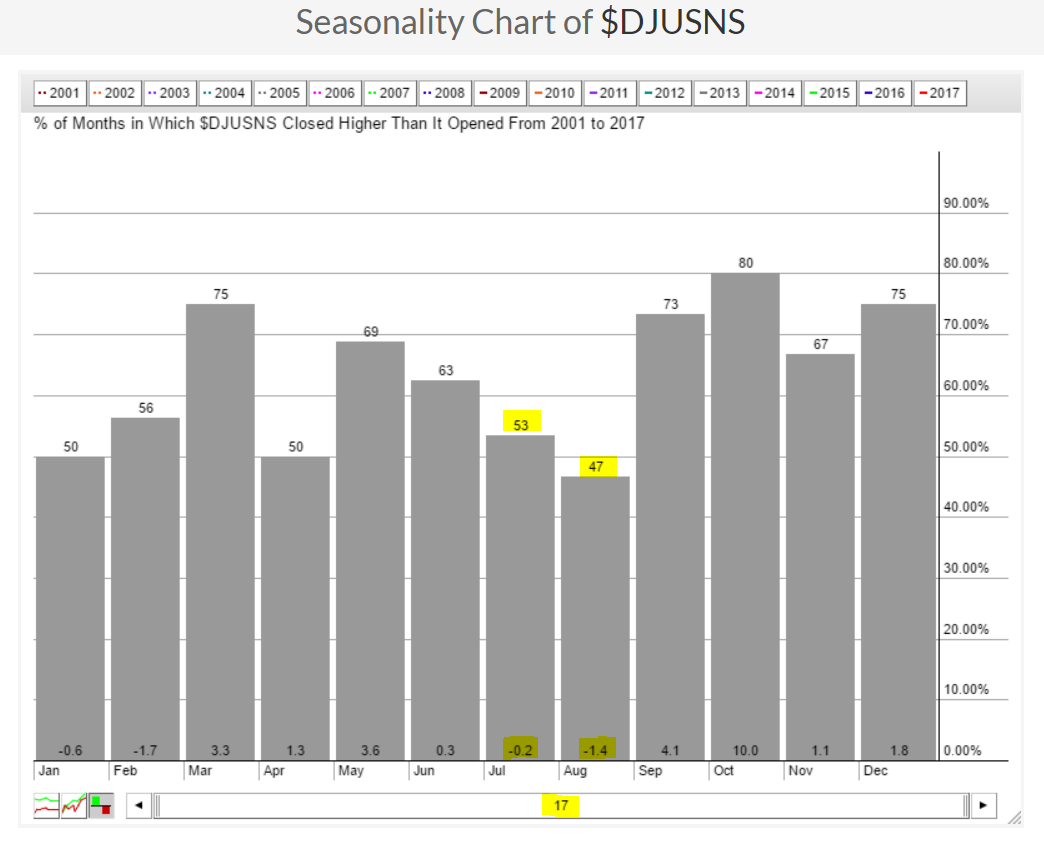 The combination of overbought technical conditions and seasonal headwinds is likely to slow the internet stocks for the next several weeks.
Key Earnings Reports
(actual vs. estimate):
INFO: .42 vs .43
DRI: 1.18 vs 1.15
FDS: 1.85 vs 1.84
Key Economic Reports
April Case-Shiller home price index to be released at 9:00am EST: +0.6% (estimate)
June consumer confidence to be released at 10:00am EST: 116.7 (estimate)
Happy trading!
Tom
