Market Recap for Thursday, June 8, 2017
Small caps were the clear and undeniable leader on Thursday as the Russell 2000 gained 1.36% while the NASDAQ was the second best performing index at +0.39%. I posted yesterday in this blog that the Russell 2000 needed to clear 1420 and on Thursday it reached a high of 1419.32 before turning back down in afternoon trading. Still, the gains were quite impressive and it enabled the Russell 2000's relative performance vs. the benchmark S&P 500 index ($RUT:$SPX) to jump significantly as well. Relative strength in small caps tends to suggest the sustainability of a bull market advance and it's been one of the lacking ingredients for me to feel aggressively bullish about the stock market. Check out this 10 year relative chart:
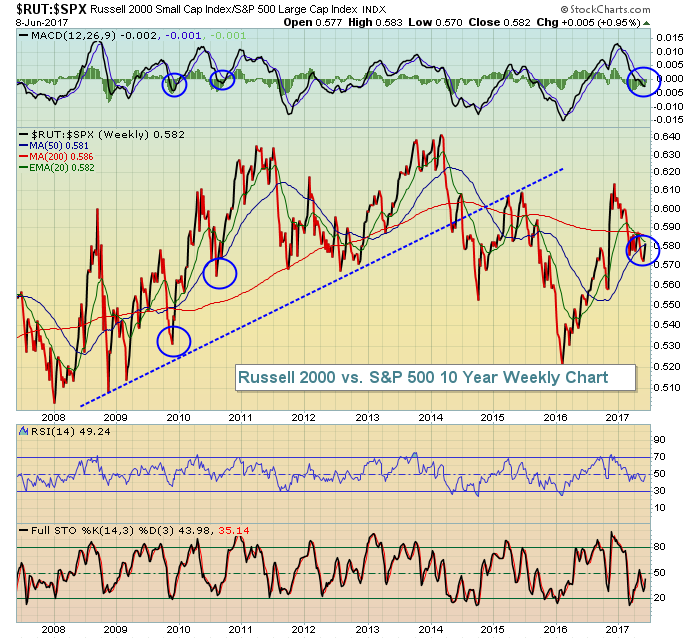 This relative ratio began rising in early 2009 as we exited one of the worst bear markets in our history. The relative uptrend continued - mostly uninterrupted - into 2014, although mid-2011 through 2012 saw a period of small cap relative weakness. It's okay for small caps to take a break before resuming their uptrend. 2014 and 2015 saw significant relative weakness before small caps soared on a relative basis in 2016. The blue circles highlight temporary dips in the relative MACD beneath the zero line and we appear to be at that stage currently. Those arguing the sustainability of the current bull market want to see this relative MACD push back above that zero line while relative price action continues the uptrend that began in 2016.
Among sectors, financials (XLF, +1.15%) has another very strong session as banks ($DJUSBK) were the leading industry group within the sector. The 10 year treasury yield ($TNX) rose near 2.20% yesterday and is up slightly again this morning. Technically, it makes sense to see treasuries selling off (with corresponding treasury yields rising) as the treasury trade has been a solid one and profit taking is to be expected as we head into a very important FOMC meeting on Tuesday/Wednesday of next week.
The rising TNX the past few sessions has also weighed on the overbought utilities sector (XLU, -0.83%), where we've also seen profit taking. Look for initial support at the rising 20 day EMA, currently at 53.20, then much stronger price support at 52.00-52.25, the price level where the XLU struggled to clear throughout March, April and much of May.
Pre-Market Action
The 10 year treasury yield ($TNX) is up again this morning and that's keeping pressure on gold prices as that metal reached a critical resistance level at 1300 earlier this week. There's short-term price resistance near 1300 and that level also marks a very critical long-term downtrend line that began with gold's top in 2011.
Crude oil ($WTIC) is attempting to gain a bit of traction after a very poor week. Crude, however, is down another nickel at last check.
Global markets are mostly higher with the Hang Seng Index ($HSI) a fractional exception. With just 30 minutes left before the opening bell, and little earnings and economic news to trade off of, Dow Jones futures are up 27 points as we close out another week today - the final week before an important FOMC meeting next week.
Current Outlook
Home construction ($DJUSHB) is an important component of our economy as the Fed showed several years back when they kept interest rates artificially low (think quantitative easing, or QE) to bolster the group and aid our economic expansion. There's a strong correlation between the performance of the DJUSHB and that of the S&P 500 as you can see below:
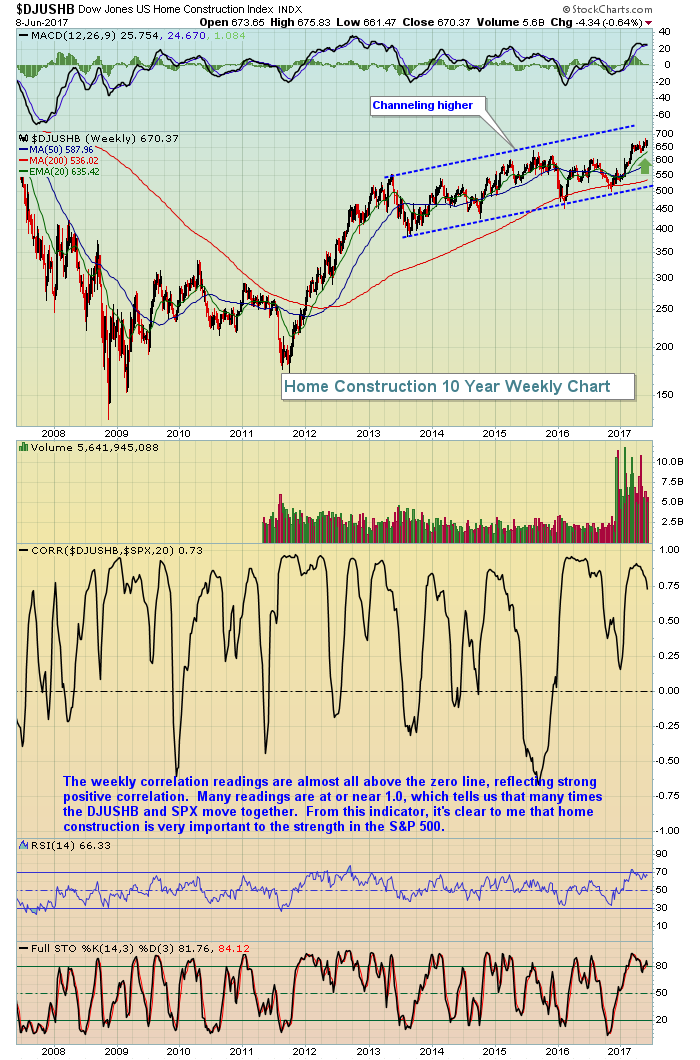 The DJUSHB has been very strong and the green arrow above shows that weakness has not yet reached even a 20 week EMA test. I see the weekly MACD still as very strong and weekly RSI and stochastic are currently at 66 and 81, neither in what I consider to be overbought territory. Therefore, I'm expecting the DJUSHB to remain strong and to aid the S&P 500 in its attempt to make higher prices this summer.
Sector/Industry Watch
One look at the consumer discretionary (XLY) sector's chart and you'll see how many short-term tops form off of uptrends. Reversing candlesticks can give us solid clues as to the market's intentions as the XLY's chart shows:
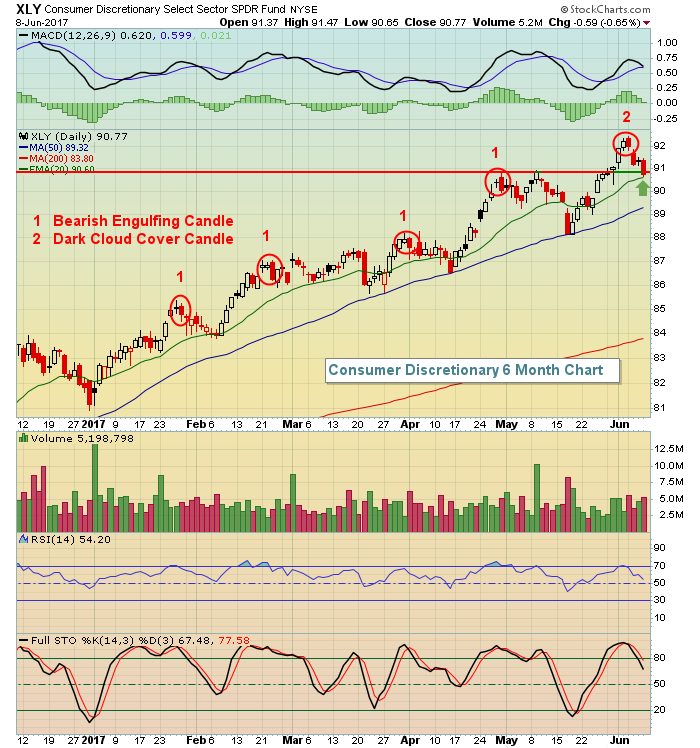 Like anything else in technical analysis, candlesticks do not provide us guarantees, but they can help us to trade smarter by helping us manage risk better. Most of the short-term tops in the XLY chart formed when a reversing candle - bearish engulfing or dark cloud cover - tipped us off to the impending reversal. The XLY has fallen three of the past four trading sessions and it's now just below price support and just above its rising 20 day EMA. I'd expect to see short-term strength in the XLY given the current technical conditions.
Historical Tendencies
Given that the XLY appears technically poised for resumption of its uptrend, the next question is.....which industry group could be a leader within the discretionary sector? Historically, business training and employment agencies ($DJUSBE) tend to go against the grain and flash seasonal summer strength. Here's a quick look at how the DJUSBE has traded by calendar month over the past five years:
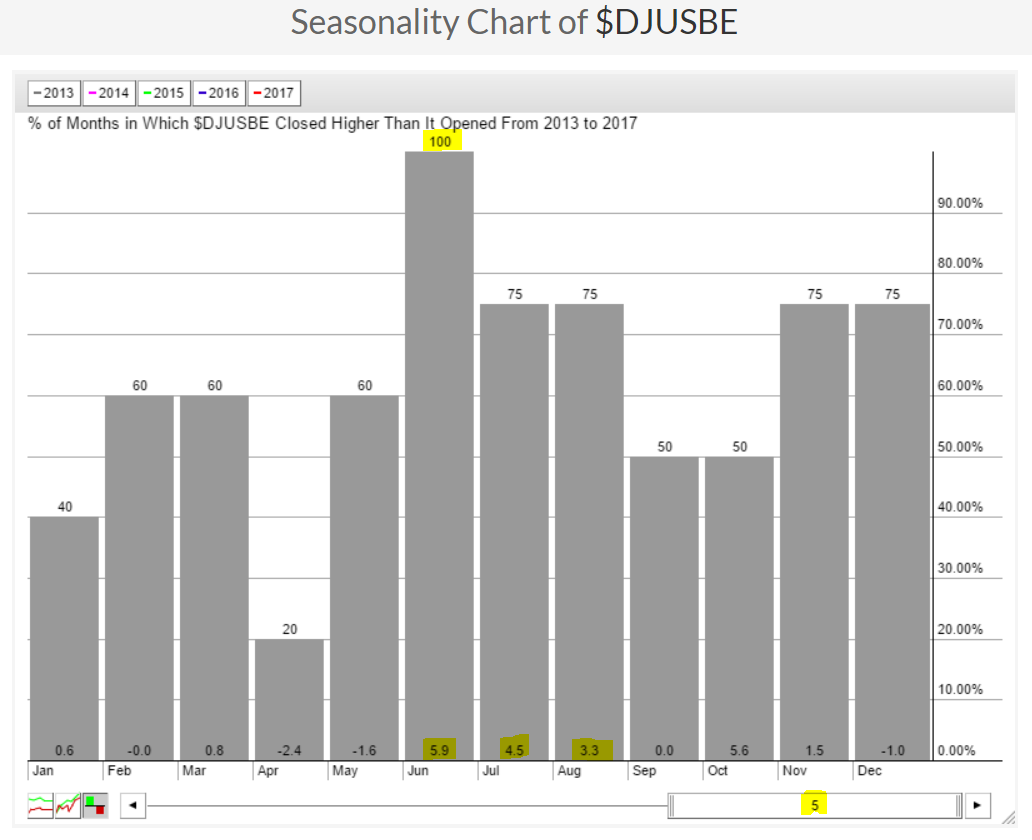 June, July and August have represented three of the best four calendar months for the DJUSBE in recent history (past 5 years). In addition, the current technical picture favors further strength this summer. Check out the bullish ascending triangle in play:
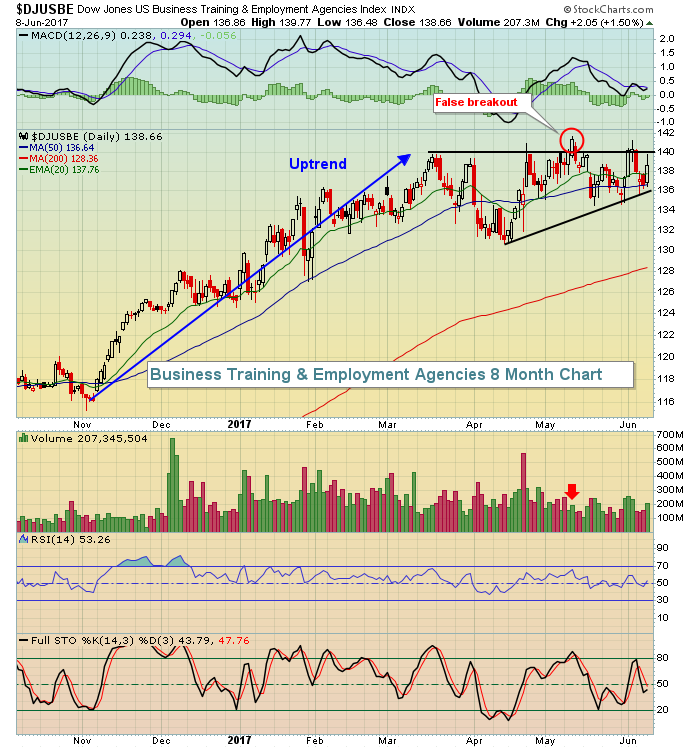 The DJUSBE did attempt a breakout in the second week of May but note the light volume (red arrow) that accompanied this breakout attempt. A close above the 140-141 level with increasing volume should be respected with further gains ahead likely - especially knowing that the DJUSBE is historically one of the best performing industry groups during the summer.
Key Earnings Reports
None
Key Economic Reports
April wholesale trade to be released at 10:00am EST: -0.3% (estimate)
Happy trading!
Tom
