Market Recap for Tuesday, June 27, 2017
The relative sector leader for over a year - technology (XLK, -1.64%) - took another beating on Tuesday as selling ramped up for a second consecutive session. All industry groups within technology took a hit, but semiconductors ($DJUSSC) and internet stocks ($DJUSNS) took the biggest hits with the former losing its 50 day SMA support for the first time since mid-April. A more significant level, however, is its longer-term, rising 20 week EMA support, which hasn't been lost since May 2016. Check out this chart:
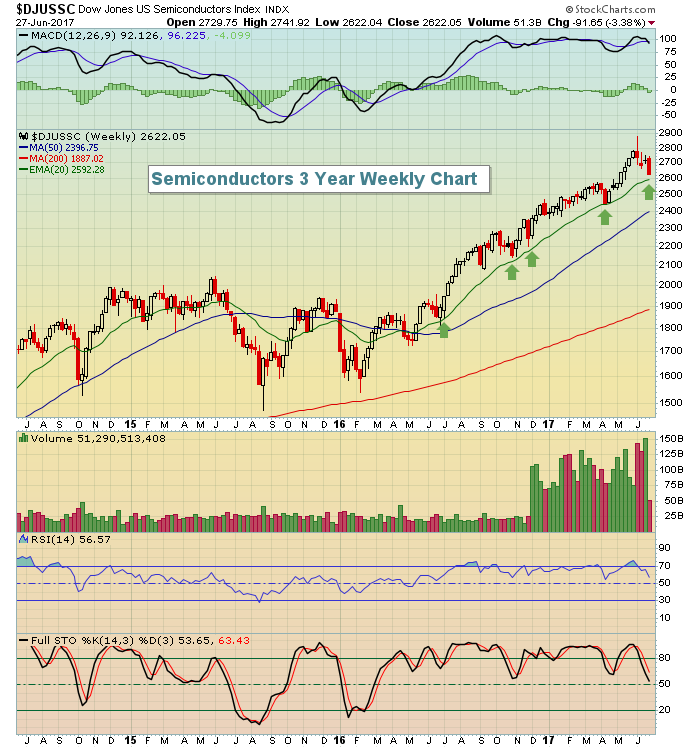 The DJUSSC was close to 2900 just a few weeks ago and yesterday we closed at 2622. This group has always been a fast mover - in both directions - and we're seeing the downside of that volatility currently. The rising 20 week EMA has been a significant area of support for a year so that'll be a very interesting moving average to watch as the selloff here continues. On a daily chart (not pictured), I see support in the 2575-2600 range. Therefore, an intraweek move to that level, followed by a close on Friday above the 20 week EMA would be a bullish scenario and represent level for new money to enter.
The lone sector to advance on Tuesday was the financial sector (XLF, +0.50%). Rising treasury yields spurred the sector as bank stocks ($DJUSBK) regained some upward momentum, touching the 410 level before settling back to 406 in afternoon trading. The XLF is challenging overhead relative resistance vs. the benchmark S&P 500 and is highlighted below in the Current Outlook section.
Pre-Market Action
Today should be quite interesting for U.S. equities. Technology stocks will be under the microscope after a second consecutive day of serious bleeding, especially since yesterday's close left the group beneath its 50 day SMA and vulnerable to further selling. Traders will be looking for recovery here OR major rotation to other areas of the market like financials. Banks could benefit once again as the 10 year treasury yield ($TNX) is up another two basis points this morning at 2.22%.
KB Homes (KBH) produced another solid quarterly earnings report in the home construction space ($DJUSHB). With pending home sales on deck at 10:00am this morning, this will likely be a group to watch as well.
Currently, with 30 minutes left before the opening bell, Dow Jones futures are set to open 34 points higher.
Current Outlook
We are suddenly seeing weakness in treasuries with the corresponding yields rising. The 10 year treasury yield ($TNX) closed above its declining 20 day EMA yesterday for the first time in seven weeks after recently filling a key gap. There's a bullish wedge that's formed and breaking that to the upside would be a very positive development for the financial sector (XLF), which had been struggling on a relative basis in 2017 due to falling treasury yields. That could be changing and is definitely worth watching. Check out the chart:
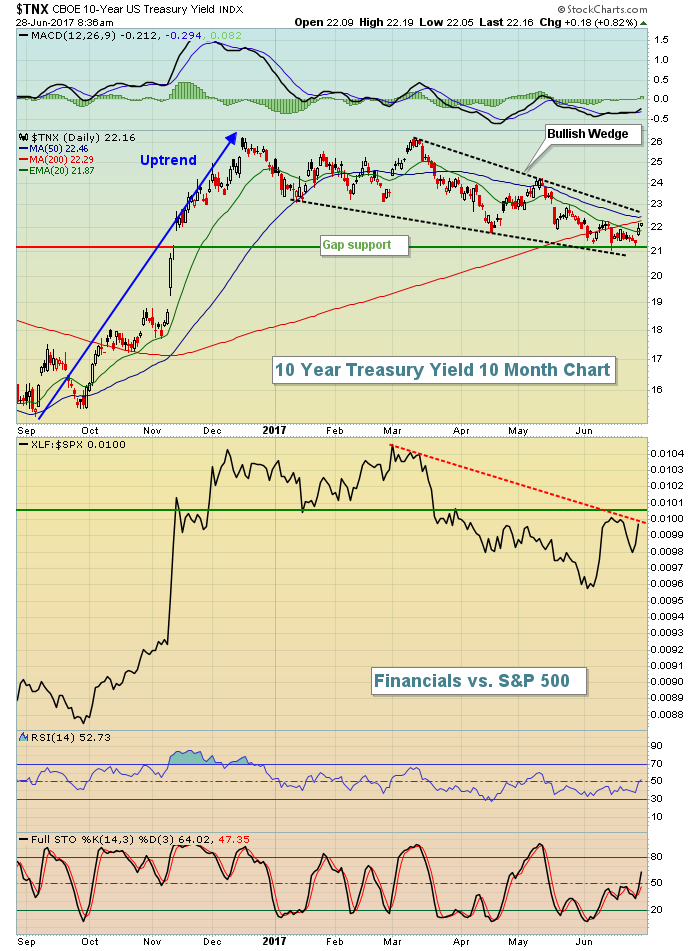 Note that we're seeing a bit more strength in the TNX this morning, potentially leading to further gains in financials as technology shares continue to weaken. This type of rotation is necessary to sustain the eight year old bull market.
Sector/Industry Watch
Biotechs ($DJUSBT) have been the darlings of traders over the past several days, but the group took a much-needed breather on Tuesday. There is a clear support level to watch on further selling, though. Here's the chart:
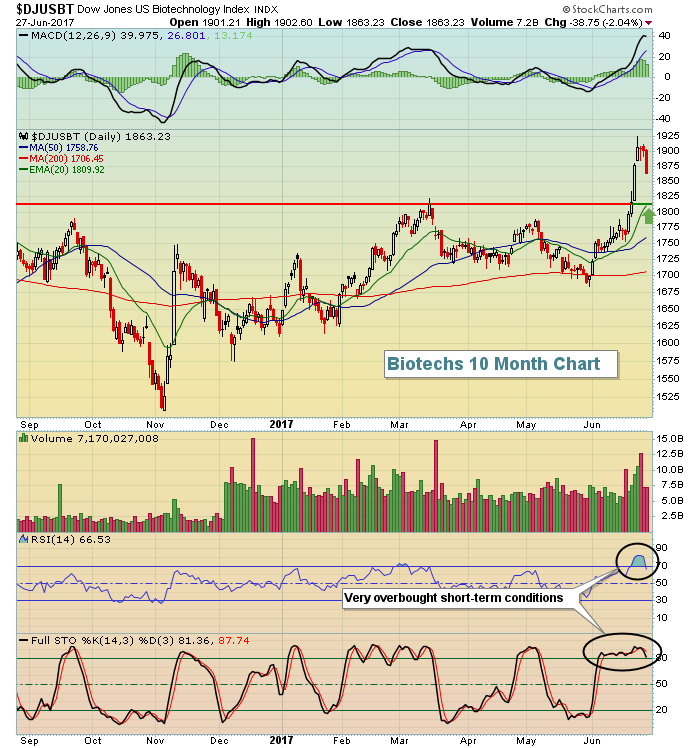 The green arrow above is key. It marks both price support and rising 20 day EMA support. The DJUSBT is very overbought and certainly entitled to a short-term breather, but these two levels of support should hold back the sellers should this group approach that price level.
Historical Tendencies
The Wednesday through Friday period of the calendar week has clearly been much more bullish over the past 67 years on the S&P 500 (since 1950) than the Monday to Tuesday period. That'll be one positive that could develop later in today's trading. Also, remember that the 26th to 28th of the calendar month also tends to begin the best 7-10 day period for the bulls.
Key Earnings Reports
(actual vs. estimate):
GIS: .73 vs .71
MON: 1.93 vs 1.74
PAYX: .54 vs .53
SJR: .44 vs .25
Key Economic Reports
May pending home sales to be released at 10:00am EST: +0.5% (estimate)
Happy trading!
Tom
