Market Recap for Friday, July 28, 2017
The U.S. stock market has been quite resilient and today wraps up a very strong July. On Friday, only the Dow Jones finished higher - and at a fresh new record high - while healthcare (XLV, +0.50%) and industrials (XLI, +0.23% were the only two sectors to finish in positive territory. The NASDAQ remained under pressure after heavy selling on Thursday afternoon kept buyers at bay. The technology bulls will see an early test on the NASDAQ's 60 minute chart as the opening bell rings:
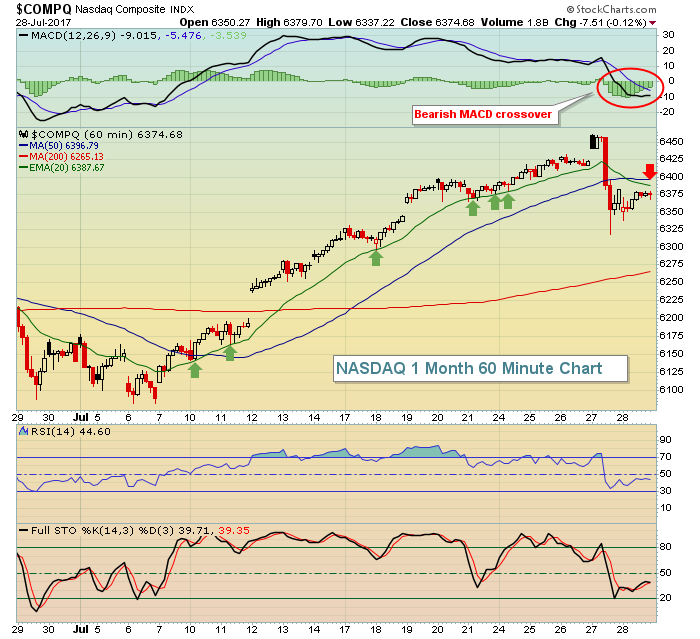 The short-term momentum has swung to the bears as the hourly MACD crossed back beneath centerline support. Throughout July, you can see that every 20 hour EMA test resulted in a bounce (green arrows), but now the momentum tide has changed so the first order of business for the bulls will be to close above that now-declining 20 hour EMA.
Healthcare stocks were led by medical supplies ($DJUSMS), which rose 1.44% on Friday is on the verge of another breakout after testing price support just two days ago. Check out the latest here:
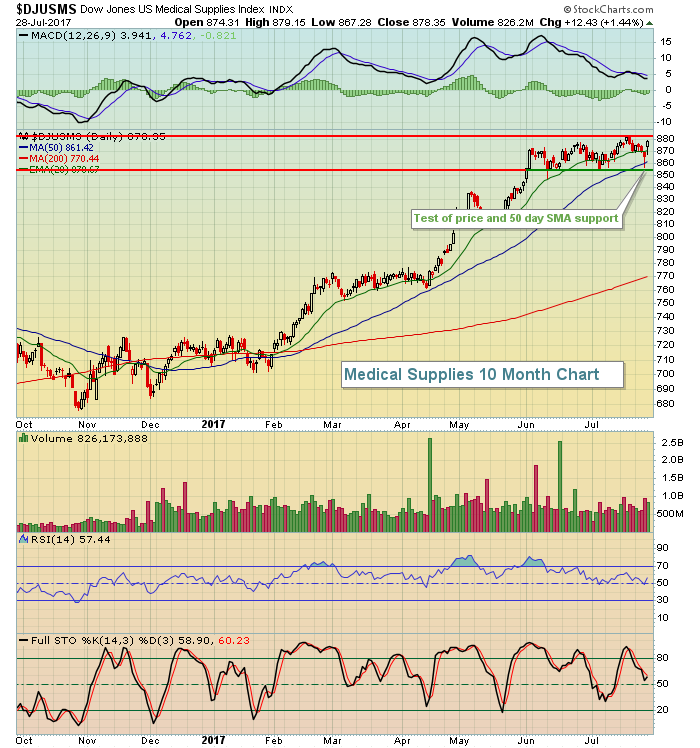 Medical supplies has been the best performing industry group within healthcare in 2017 and it's showing few signs of letting up. The recent consolidation enabled its overbought RSI to pullback near the 50 level and as it nears breakout territory, its RSI is only 57.
Pre-Market Action
Crude oil ($WTIC) is pausing just beneath $50 per barrel after a very nice push higher the past 5-6 weeks. That's done little to slow U.S. futures as the Dow Jones looks set to open up higher this morning. Dow Jones futures are up more than 60 points with less than 30 minutes to the opening bell.
Current Outlook
Energy (XLE, -0.12%) has been the beaten stepchild of 2017 among sectors. There are clearly signs of life, though, as the wall of resistance at 67.00 nearly fell on Friday. We've already seen a trendline break and a bullish MACD crossover (blue circles below) on the daily chart and that's a short-term bullish development:
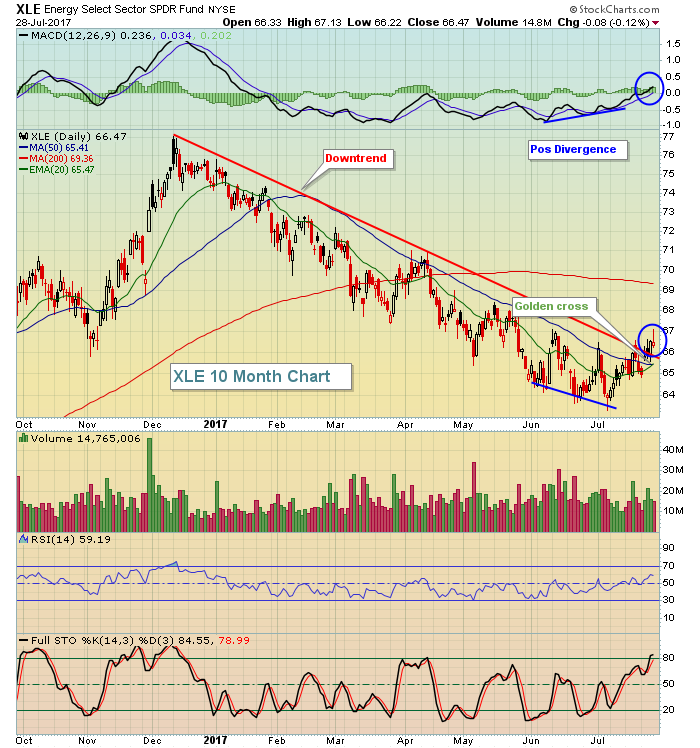 Throw in the "golden cross" (20 day moving average crosses above 50 day), the RSI nearing 60 for the first time in 2017 and the improved volume trends and it's time to jump in on this freight train, right?
Well, not so fast. The longer-term charts always carry more weight and we're at a very significant juncture where price action typically reverses:
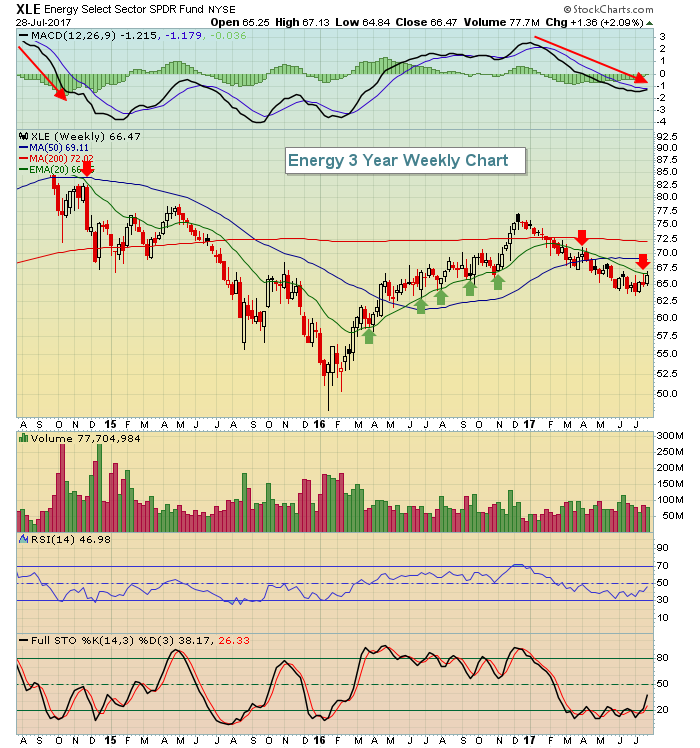 During the 2016 advance, check out the multiple 20 week EMA tests as the bears failed to take advantage of short-term weakness. Now we're on the other side with an established downtrend in play where the bears will likely attempt to use a 20 week EMA test as an opportunity to increase short positions.
Energy most definitely has improved on its shorter-term daily chart, but be careful knowing this is an area where we could see a reversal on the longer-term weekly chart.
Sector/Industry Watch
Industrials had a nice day on Friday, as mentioned above, and defense stocks ($DJUSDN) led the rally. The group had recently broken out above price resistance near 395 and, on Friday, returned to test that level of price support. Check it out:
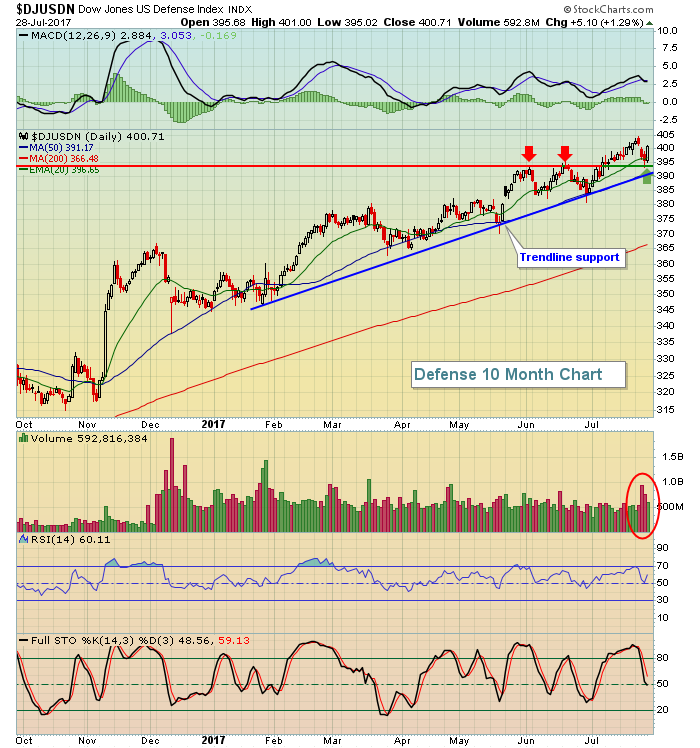 There remains solid support in the 390-395 range. Note the heavy volume on the recent selling? Remember - it's the combination of price and volume. While volume was much heavier than usual during the selling, no significant price support level was lost. I only turn more bearish when volume accelerates and price support is lost. That wasn't the case here and the bulls continue to hold the upper hand.
Monday Setups
Agilent Technologies (A) struggled last week, but did manage to hold onto its 50 day SMA support. So I'm looking for a bounce this week:
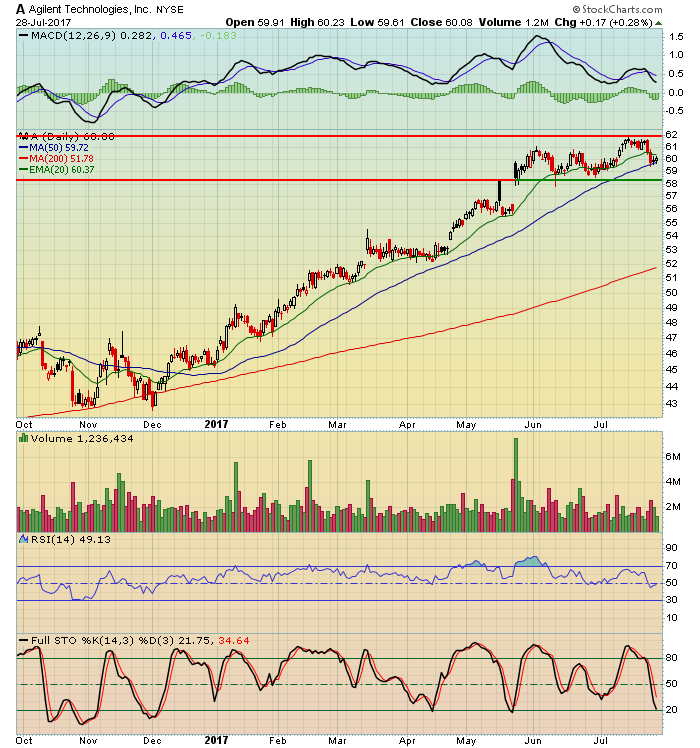 The current price down to price support closer to 58.25 represents an accumulation zone in my opinion. I'll have several more trading setups for this week so please be sure to join me and Greg Schnell on MarketWatchers LIVE at noon EST. CLICK HERE any time after 11:45am EST today to join the show!
Historical Tendencies
While July 31st doesn't tend to follow historical norms, at least be aware of the fact that the 31st day of calendar months has produced annualized returns of 30.37% over the past seven decades on the S&P 500. That ranks the 31st as the fourth best trading day of the calendar month, trailing only the 1st, 2nd and 16th days of the month.
Key Earnings Reports
(actual vs. estimate):
CNA: .88 vs .75
L: .76 vs .76
ROP: 2.24 vs 2.22
SNY: .74 vs .74
(reports after close, estimate provided):
CGNX: .55
ITUB: .28
SBAC: .20
VNO: 1.26
Key Economic Reports
July Chicago PMI to be released at 9:45am EST: 62.0 (estimate)
June pending home sales to be released at 10:00am EST: +0.9% (estimate)
Happy trading!
Tom
