Market Recap for Friday, June 30, 2017
We once again witnessed market bifurcation with both the Dow Jones and S&P 500 rising slightly, while the more aggressive NASDAQ and Russell 2000 finished with absolute and relative weakness. The Dow Jones received a big lift from Nike (NKE), which blew away earnings estimates, and Caterpillar (CAT) as CAT moved higher to test its mid-June high at 108.
CAT lifted the commercial vehicles & trucks industry group ($DJUSHR) while a much-maligned industrial group - industrial suppliers ($DJUSDS) - is looking to reverse a major downtrend. The group rallied 1.74% on Friday, but will need more buyers to clear its 250-255 price resistance zone:
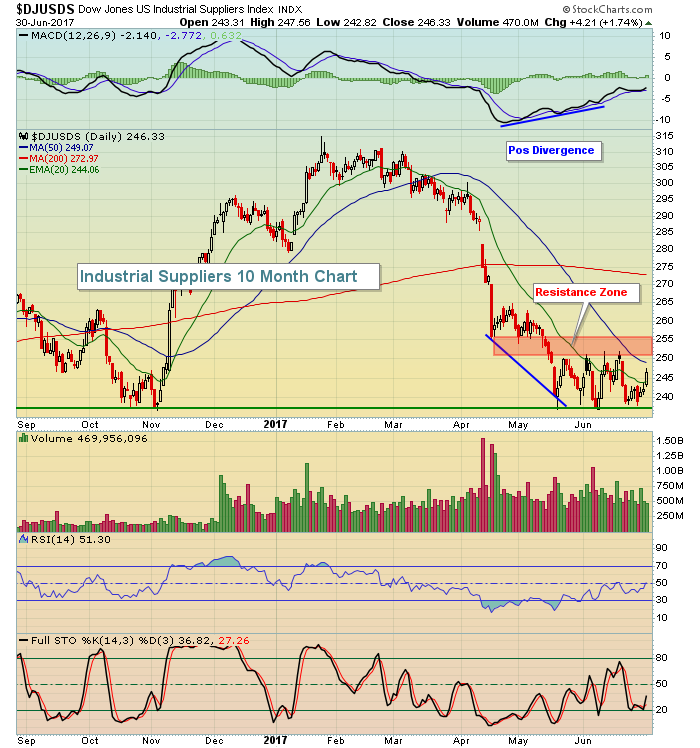
With that positive divergence in place, a breakout above the 250-255 resistance zone could certainly lead to a strong period of relative outperformance for this group so it's worth keeping an eye on. I like that test of price support from October/November 2016 and we could be seeing accumulation at current levels.
Banks ($DJUSBK) and life insurance companies ($DJUSIL) took the day off on Friday as the rising 10 year treasury yield ($TNX) paused at 2.30% resistance. Another climb in the TNX, however, would likely rekindle significant interest in both of these industry groups.
Pre-Market Action
Gold ($GOLD) is under pressure once again as it remains mired in its recent downtrend. Crude oil ($WTIC) continues to push higher and is now above $46 per barrel.
Dow Jones futures are strong to open a fresh trading week, up nearly 70 points with 30 minutes left to the opening bell. NASDAQ shares are even stronger as technology attempts to rebound in July after a very difficult June.
Current Outlook
One of the key relative ratios that I follow to attempt to predict the sustainability of an equity market advance is $TRAN:$UTIL. This is a very simple ratio that compares the price performance of transportation stocks to utility stocks. A rising trendline means that investors/traders favor transportation stocks, typically indicative of their belief that economic strength lies ahead, along with rising interest rates. Of course the latter is a major headwind to the utilities sector as their dividend yields look less attractive when treasury yields are rising. Here's the current view of this ratio:
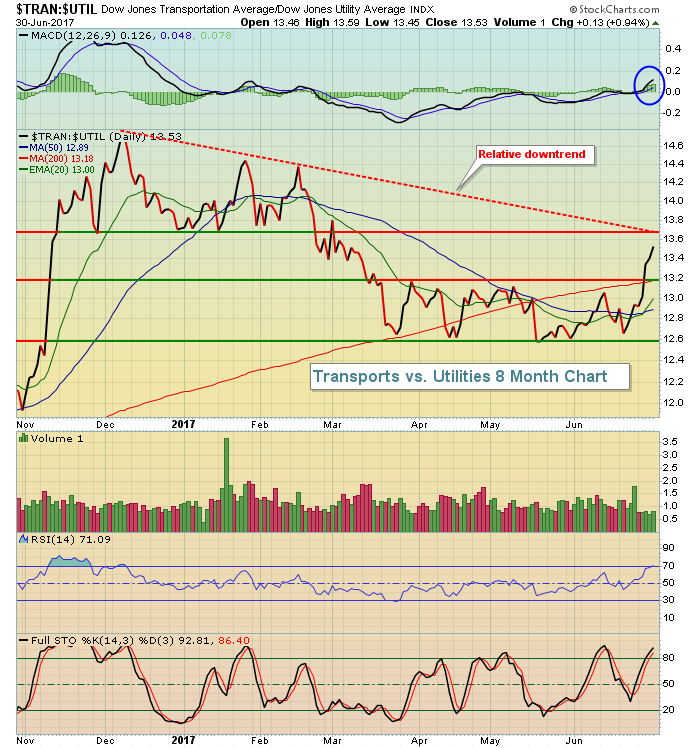 If you're in the bullish camp, you have to like the current momentum in traders' psyche. They've begun to flock towards transports on a relative basis as the bullish MACD crossover and recent relative price breakout highlight. Another big relative hurdle awaits, however, at the 13.7 level where both relative price resistance and relative trendline resistance reside together.
Sector/Industry Watch
Given the absolute and relative strength in industrials, it's difficult to ignore one of the big industrial names - General Electric (GE) - that's now challenging major intermediate-term price support. "The General" is testing a very critical price support level in the 26.00-27.00 area and its rising 200 week SMA should provide technical support as well. Take a look at this potential longer-term trading setup:
 With the exception of the move lower in the 3rd quarter of 2015, GE has been within the confines of a very well-defined up channel and it now also resides at price support. Given the weekly RSI at 36, GE appears poised to resume its longer-term uptrend. A weekly close below 26 could be considered for a stop while a target of 32 to test the 2016 high seems justified.
Monday Setups
Adobe Systems (ADBE) recently gapped higher with very strong quarterly revenues and earnings that both beat Wall Street consensus estimates. But after establishing a short-term price high near 147.50, ADBE faltered on lighter volume as profit takers cashed in. It's returned to gap support and now appears poised to make another short-term run to test its recent highs. Here's the technical picture:
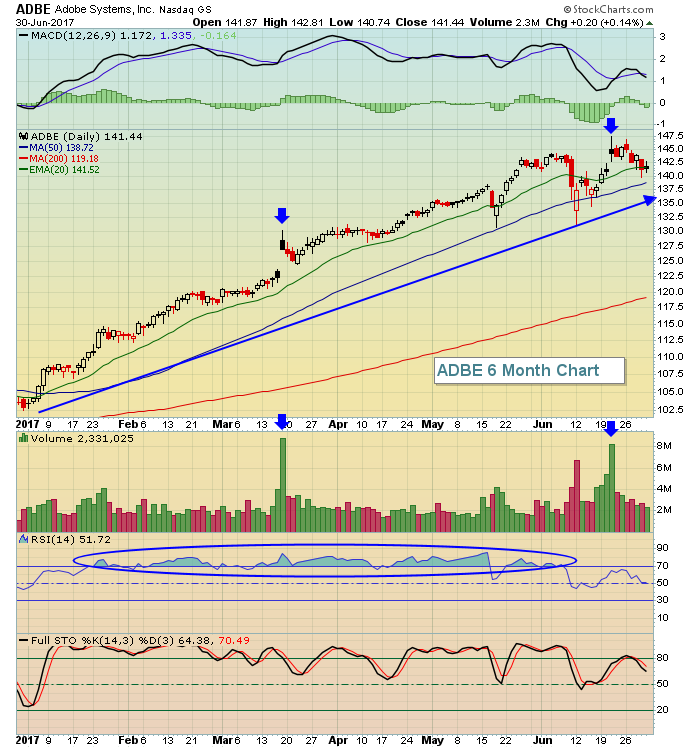 ADBE has spent much of 2017 in very overbought territory as its RSI was above 70 almost entirely from mid-January to early June. Traders have gravitated towards ADBE after each of its past couple earnings reports (blue arrows) and the recent selling down to its 20 day EMA likely represents a solid entry point. A close below 140 could lead to ADBE retesting price lows closer to 130 in May and June so consider keeping a tight closing stop near 140. A short-term target could be established at 147.00-147.50 to test the recent high.
Historical Tendencies
July is a very interesting calendar month for the S&P 500. Its performance since 1950 sits right in the middle of significant seasonal weakness from May through September. Check out the average monthly returns for each of these months over the past 67 years:
May: +2.84%
June: -0.02%
July: +12.21%
August: -1.07%
September: -6.01%
July annualized performance can be broken down further, however. Take a look at how the various periods within July perform:
1st through 17th: +23.76%
18th through 23rd: -23.73%
24th through 31st: +17.93%
Key Earnings Reports
None
Key Economic Reports
June PMI to be released at 9:45am EST: 52.2 (estimate)
June ISM manufacturing to be released at 10:00am EST: 55.1 (estimate)
May construction spending to be released at 10:00am EST: +0.5% (estimate)
Happy trading!
Tom
