Market Recap for Wednesday, August 23, 2017
Industrials (XLI, -0.94%) and consumer discretionary (XLY, -0.85%) led a move lower in U.S. stocks on Wednesday as we approach the gathering of global central bankers in Jackson Hole over the next few days. Energy (XLE, +0.43%) managed to push higher as money rotated into the beleaguered sector as exploration & production stocks ($DJUSOS) bounced. Unfortunately, the DJUSOS looks awful technically with overhead resistance another 2% above current price. So perhaps we'll get a bit more of a bounce, check it out:
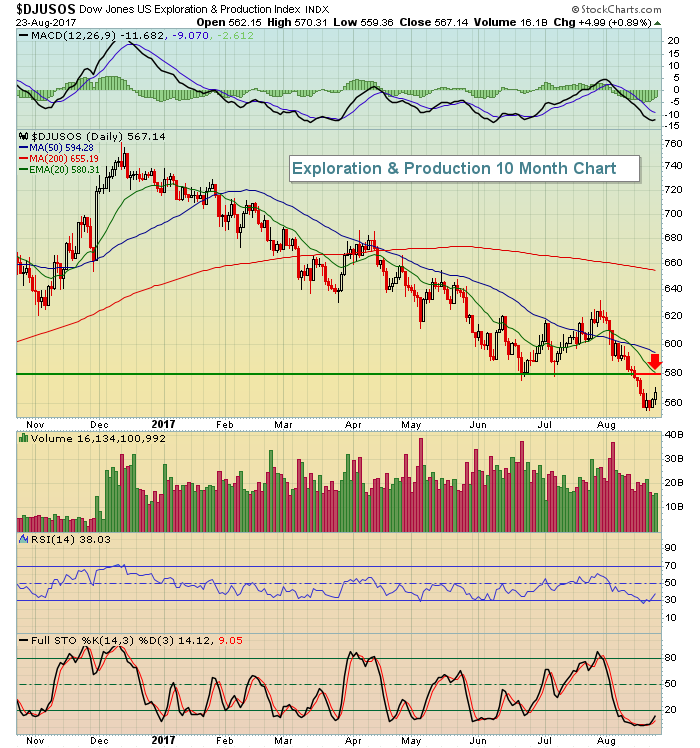 Both price resistance and the declining 20 day EMA connect near the 580 level. I'd be surprised to see this "recovery" extend much beyond that level.
Despite the aggressive sectors being mostly weak on Wednesday, we did see solid performance from automobiles ($DJUSAU, +1.23%), REITs ($DJR, +0.87%) and semiconductors ($DJUSSC, +0.37%).
Pre-Market Action
The Jackson Hole Economic Policy Symposium begins today with Fed Chair Janet Yellen to speak tomorrow. As we head into the meeting, the 10 year treasury yield ($TNX) is mired in a two month downtrend and just above the June lows.
U.S. equities are set to rebound from yesterday's selling with Dow Jones futures higher by 56 points with a bit more than 30 minutes until the opening bell.
Current Outlook
Yesterday's action, while mostly negative, did manage to hold above key 20 hour EMA support on the benchmark S&P 50. As a reminder, here is the chart that I posted yesterday. With futures higher this morning, I'd continue to look for short-term support at that rising moving average:
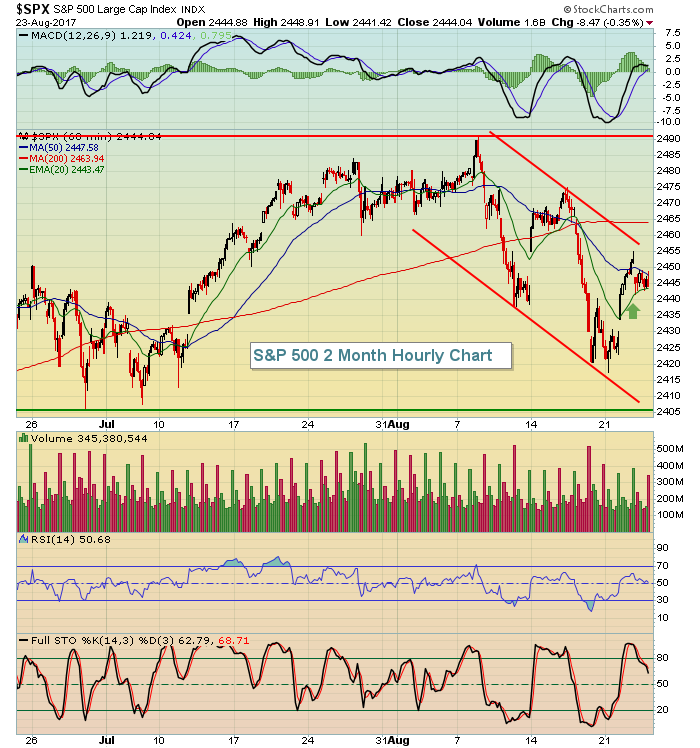 A break above the down channel would likely lead to another test of price resistance at 2475.
Sector/Industry Watch
Industrials have struggled the past few months as the XLI has gained just over 1%. One of the big reasons for the underperformance has been heavy construction ($DJUSHV), which has been trending lower throughout 2017. It has hit an area of support that needs to hold:
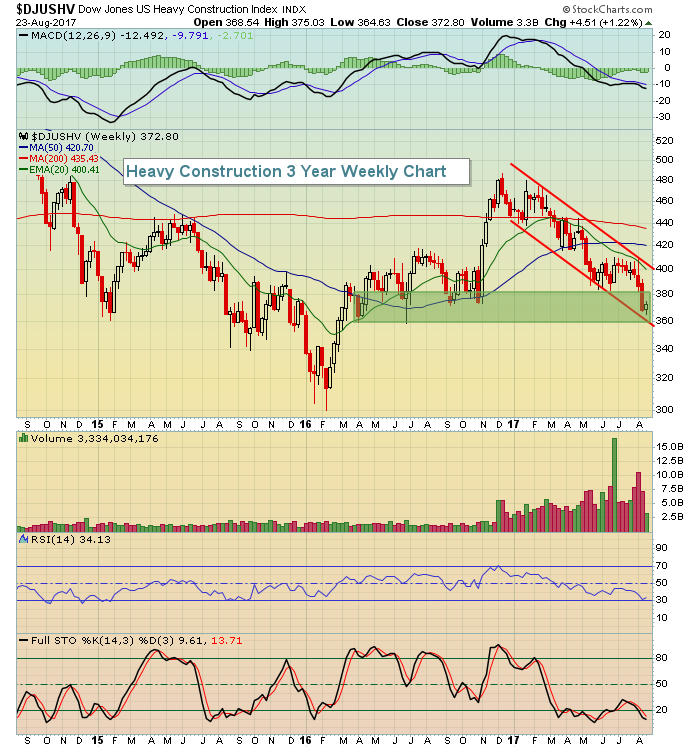 The down channel remains intact and the price support from 2016 is being tested. Does support hold and the upper downtrend line break? That's the bullish scenario. If the 360-380 support range fails to hold, it could be a quick trip down to 300.
Historical Tendencies
The NASDAQ has performed exceptionally well on Wednesdays, Thursdays and Fridays since 1971. Mondays have produced huge annualized losses while Tuesdays have been mostly flat over the past 46 years.
Key Earnings Reports
(actual vs. estimate):
CM: 2.00 vs 1.99
(reports after close, estimate provided):
ADSK: (.37)
AVGO: 3.50
ULTA: 1.78
VMW: .83
Key Economic Reports
Initial jobless claims released at 8:30am EST: 234,000 (actual) vs. 237,000 (estimate)
July existing home sales to be released at 10:00am EST: 5,565,000 (estimate)
Happy trading!
Tom
