Market Recap for Thursday, September 14, 2017
Consumer discretionary (XLY, -0.54%) was the worst performing sector on Thursday, but you'd never know it from looking at the automobiles or auto parts stocks. The Dow Jones U.S. Automobiles & Parts Index ($DJUSAP) is featured below in the Sector/Industry Watch section, so I'll get to that in a bit. Travel & tourism stocks ($DJUSTT) and broadcasting & entertainment stocks ($DJUSBC) both lost more than 1% yesterday as discretionary stocks lagged. Walt Disney (DIS), a major component of the latter group, has struggled quite a bit of late but has very good seasonal news that I also share below in the Historical Tendencies section.
The Dow Jones managed to eke out its third consecutive all-time high close Thursday, but leadership came mostly from utilities (XLU, +0.84%), energy (XLE, +0.48%) and industrials (XLI, +0.48%). The XLU bounced in part due to the 10 year treasury yield ($TNX) failing to clear its overhead 50 day SMA at 2.23%. Yesterday's high on the TNX was 2.23% before settling back to 2.20% on the close. That reversal sent investors back into the defensive utilities area.
Energy is perhaps the biggest deal right now technically. It's a group that I've avoided for quite some time and now has risen to test major price resistance at 67, where we could've seen the right side of a neckline form yesterday. The weekly chart is one to watch today - to see what this week's candle looks like. Check this out:
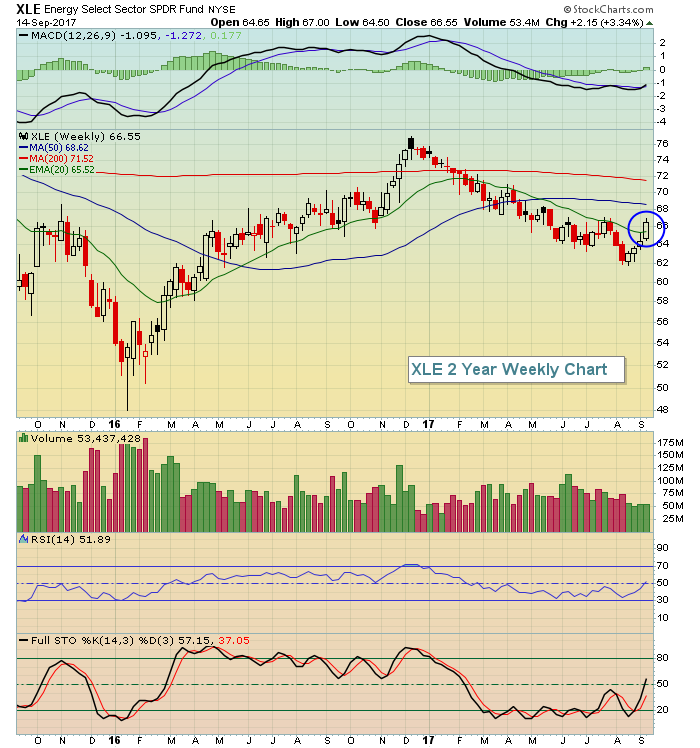 Notice all the intraweek failures at the declining 20 week EMA? Well, with one day left in this week, we've cleared that moving average. But can we hold it into today's close? It's something to watch.
Pre-Market Action
Dow Jones futures are down slightly (9 points) with 30 minutes left to the opening bell. Retail sales data was weaker than expected and global markets are flat to down, contributing to the potential flat to weak open on Wall Street.
Current Outlook
The breakouts to all-time highs in recent days are very bullish. We do have short-term issues to deal with, however. Check out the hourly MACD on the Dow Jones, for instance:
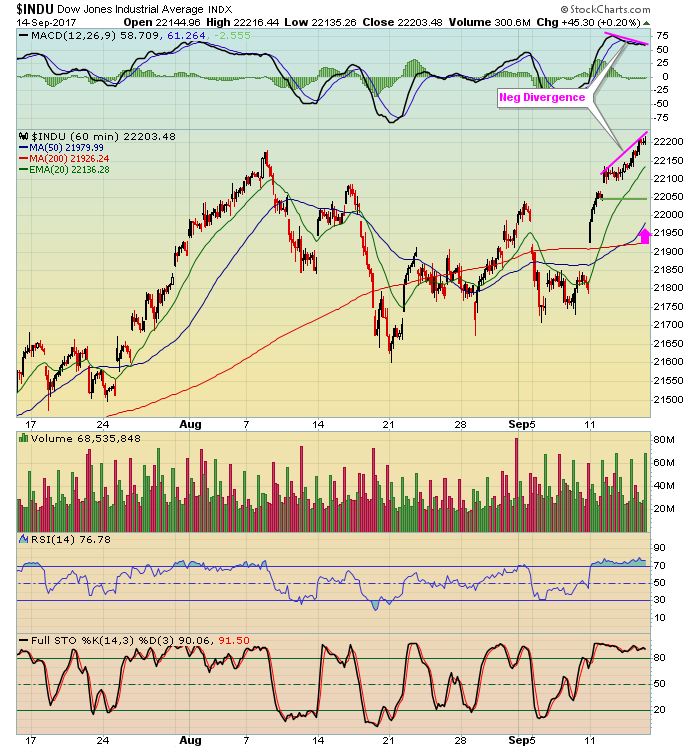 The pink arrow marks the rising 50 hour SMA, where I generally look for an initial pullback after a negative divergence prints. Also, gap support close to 22050 should be watched as well.
Sector/Industry Watch
On the morning of Friday, September 1st, just two weeks ago, I highlighted the automobiles & parts index ($DJUSAP) and the fact that it was making not only a short-term breakout, but also a significant breakout from a long-term weekly basing pattern that dated back to 2014 and 2015. These types of breakouts are very important as we normally see technical buyers line up once the major resistance has been broken. Check out what's happened to the DJUSAP since the breakout two weeks ago:
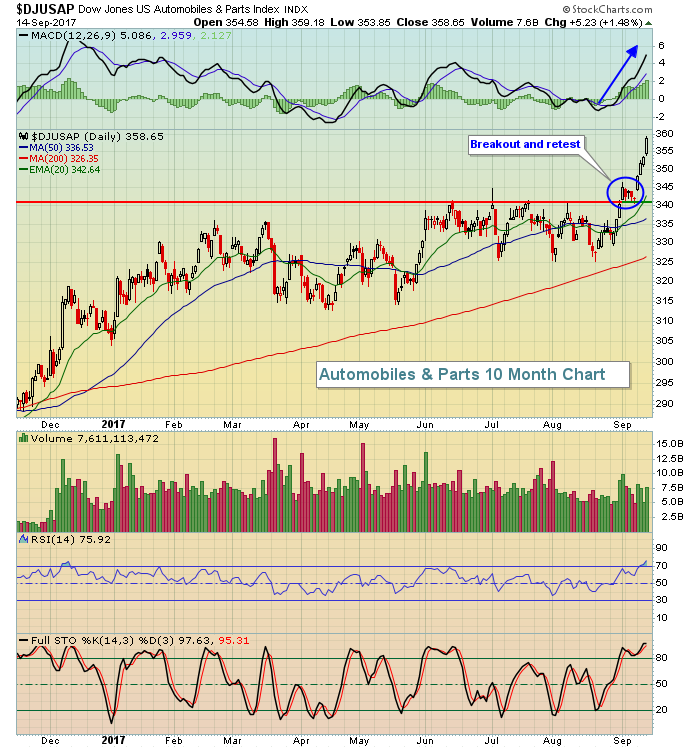 Over the past three years, we've seen multiple tests at the 340-342 level and then we finally broke through on September 1st. The DJUSAP is now quite overbought and primed for a pull back and some profit taking. But keep an eye on that rising 20 day EMA, currently at 342, as that coincides with major price support at that level as well.
Historical Tendencies
Walt Disney (DIS) has been under tons of selling pressure lately as it's fallen from 115 in late April to the recent low near 96. There's a gap support zone from 93.75-95.75 from November 2016 that bears watching. The selling of late shouldn't be a complete shock if you're familiar with the seasonal trends for DIS. June through September have all been very weak calendar months for DIS as all have posted average losses over the past 20 years. October, however, begins a much more bullish period with the following average monthly gains:
October: +3.3%
November: +3.1%
December: +1.1%
January: +2.5%
February: +3.5%
March: +1.4%
April: +3.7%
It makes seasonal sense to be accumulating DIS during its current downtrend.
Key Earnings Reports
None
Key Economic Reports
August retail sales released at 8:30am EST: -0.2% (actual) vs. +0.1% (estimate)
August retail sales excluding autos released at 8:30am EST: +0.2% (actual) vs. +0.5% (estimate)
September Empire State manufacturing survey released at 8:30am EST: 24.4 (actual) vs. 19.0 (estimate)
August industrial production to be released at 9:15am EST: +0.1% (estimate)
August capacity utilization to be released at 9:15am EST: 76.7% (estimate)
July business inventories to be released at 10:00am EST: +0.2% (estimate)
September consumer sentiment to be released at 10:00am EST: 96.0 (estimate)
Happy trading!
Tom
