Market Recap for Monday, September 18, 2017
It was another very bullish day on Wall Street as most indices finished with gains once again. The Russell 2000 ($RUT) led the charge with a 0.65% rise. Gains in the Dow Jones and S&P 500 were more modest, but still both managed to close at fresh all-time highs. It's difficult to be disappointed with that type of action.
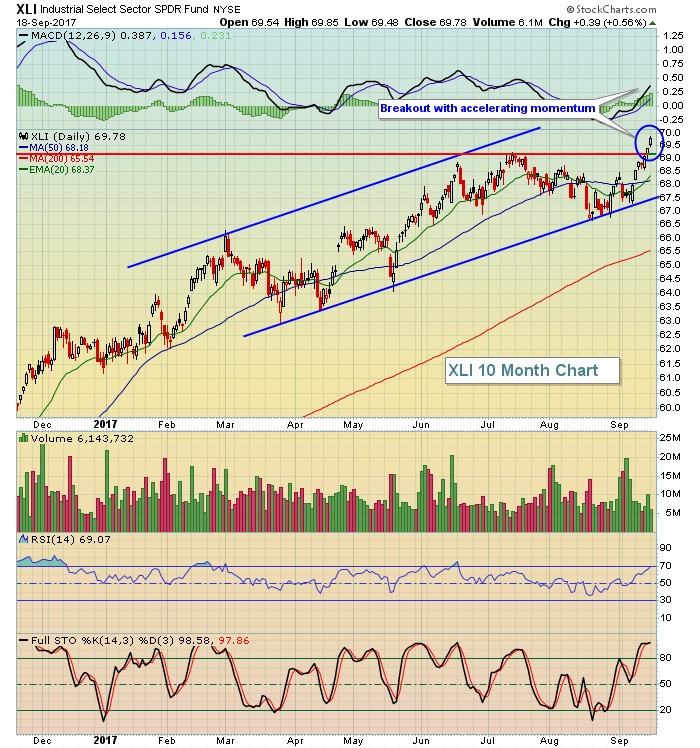
Financials (XLF, +1.17%) had another strong day as banks ($DJUSBK) surged 1.55%, easily clearing a recent price resistance level near 415. The group finished trading on Monday at 419. Citigroup (C) rose to a fresh new high on solid volume to pace the advance. Perhaps more important technically was the rise in industrials (XLI, +0.56%). While the percentage increase might have been smaller than the XLF, the technical consequences were much more significant. Look at the chart and the breakout:
 While the majority of areas of the U.S. market are rising to support the continuing bull market, utilities (XLU, -1.02%) are struggling and it's understandable given the rising treasury yields ahead of the FOMC meeting that starts today and the negative divergence that printed on its daily chart on its last high earlier in September. I'd look for a 50 day SMA test there, at a minimum.
Pre-Market Action
Gold ($GOLD) has at least temporarily halted its recent slide lower as bulls there will be looking for some support at the 1300 level. Crude oil ($WTIC) is back above $50 per barrel and energy has reclaimed some relative strength in recent days. Rising crude oil prices will only add to that renewed relative strength.
Global markets were mixed overnight as the Tokyo Nikkei ($NIKK) enjoyed a bullish session (+1.96%), while other key indices in Asia were mostly lower. European indices are mixed this morning as well, with most hovering near the flat line.
Dow Jones futures are up 15 points with 30 minutes left to the opening bell and seem to be following the European lead.
Current Outlook
Energy (XLE) closed at its highest level since late May. This follows the XLE's first weekly close above its 20 week EMA since late February. The tide appears to be turning for this sector and that's great news for the overall U.S market. The XLE has been the laggard, but is now showing signs of technical strength. The group's first key test will be whether it can hold its rising 20 week EMA on its first bout of weakness. Here's the chart:
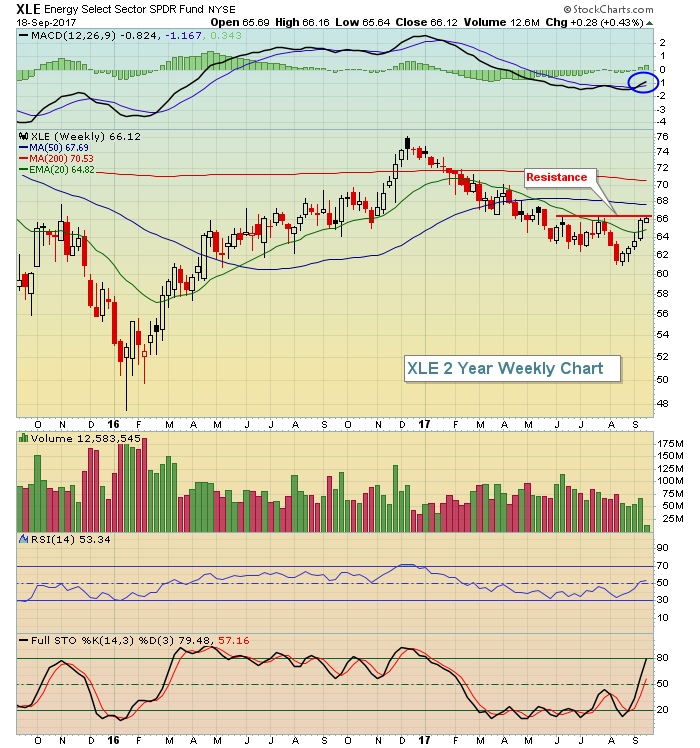 A couple points to make here. Energy is not out of the woods just yet. We saw a very similar head fake at the end of 2015. Notice the breakout above the declining 20 week EMA and the RSI 80 "touch"? Then came the swift move lower. Check out where we currently stand. Weekly RSI is at 80 and we've just closed above the 20 week EMA. I really like the close on the XLE above 66 yesterday. It was our highest daily close since late May. However, weakness ahead and a weekly close below that now-rising 20 week EMA would be a technical blow, so keep an eye out for that possibility. I'm completely on board with those wanting to trade the XLE as a bullish breakout. But given its multiple head fakes, I'd simply keep my stop in place near the 64 level. Technically, there's no reason for the XLE to fall that far.
Sector/Industry Watch
There's an industry group within materials that we need to keep a very close eye on. We've been channeling lower in this industry throughout 2017, but the year-to-date downtrend is part of a longer-term uptrend. It would be significant to see a technical breakout because the fourth quarter is seasonally bullish for the group. Check out the steel group ($DJUSST):
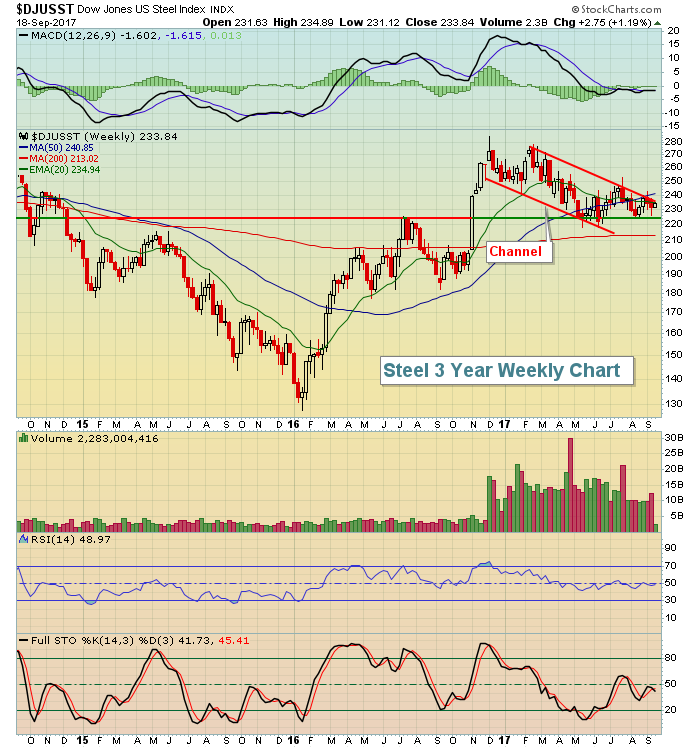 I'd like to see price support in the 220-225 area continue to hold and eventually see a breakout of the channel to the upside. If that occurs, a seasonally strong fourth quarter should kick in to help drive prices higher.
Historical Tendencies
Now for the seasonal bullishness of steel ($DJUSST):
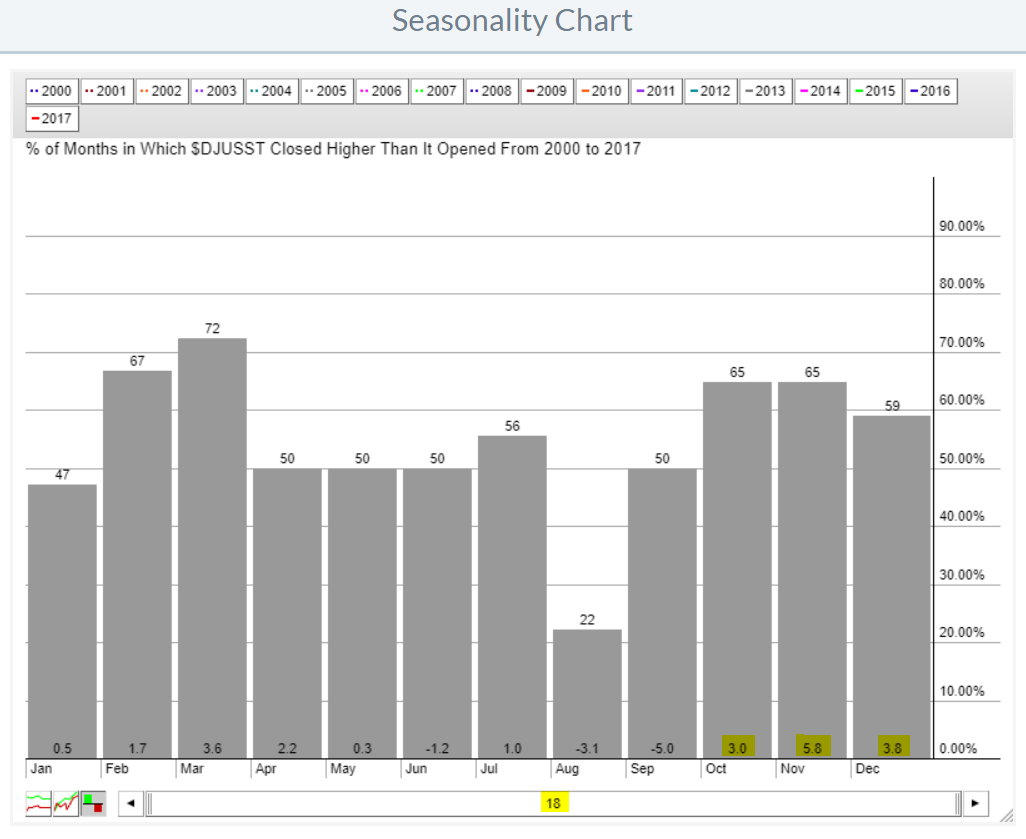 Over the past 18 years, the DJUSST averages rising 12.6% during the 4th quarter alone. Keep this group on your radar. Steel Dynamics (STLD) is a stock in this industry that looks solid technically, performs very well during the 4th quarter and currently resides near both price and 50 week SMA support.
Key Earnings Reports
(reports after close, estimate provided):
ADBE: .82
BBBY: .95
FDX: 3.16
LEN: 1.02
Key Economic Reports
FOMC meeting begins
August housing starts released at 8:30am EST: 1,180,000 (actual) vs. 1,173,000 (estimate)
August building permits released at 8:30am EST: 1,300,000 (actual) vs. 1,220,000 (estimate)
Happy trading!
Tom
