Market Recap for Wednesday, December 20, 2017
It's been a rough road for oil equipment & services stocks ($DJUSOI, +2.33%). They haven't broken down below summer lows, but they also haven't kept pace with the energy sector as a whole either. Yesterday's strength did take the group closer to key price resistance as they once again attempt to muster a lengthier rally. Energy (XLE, +1.41%) also got a lift on Wednesday from the much more bullish exploration & production industry ($DJUSOS). Take a look at this chart:
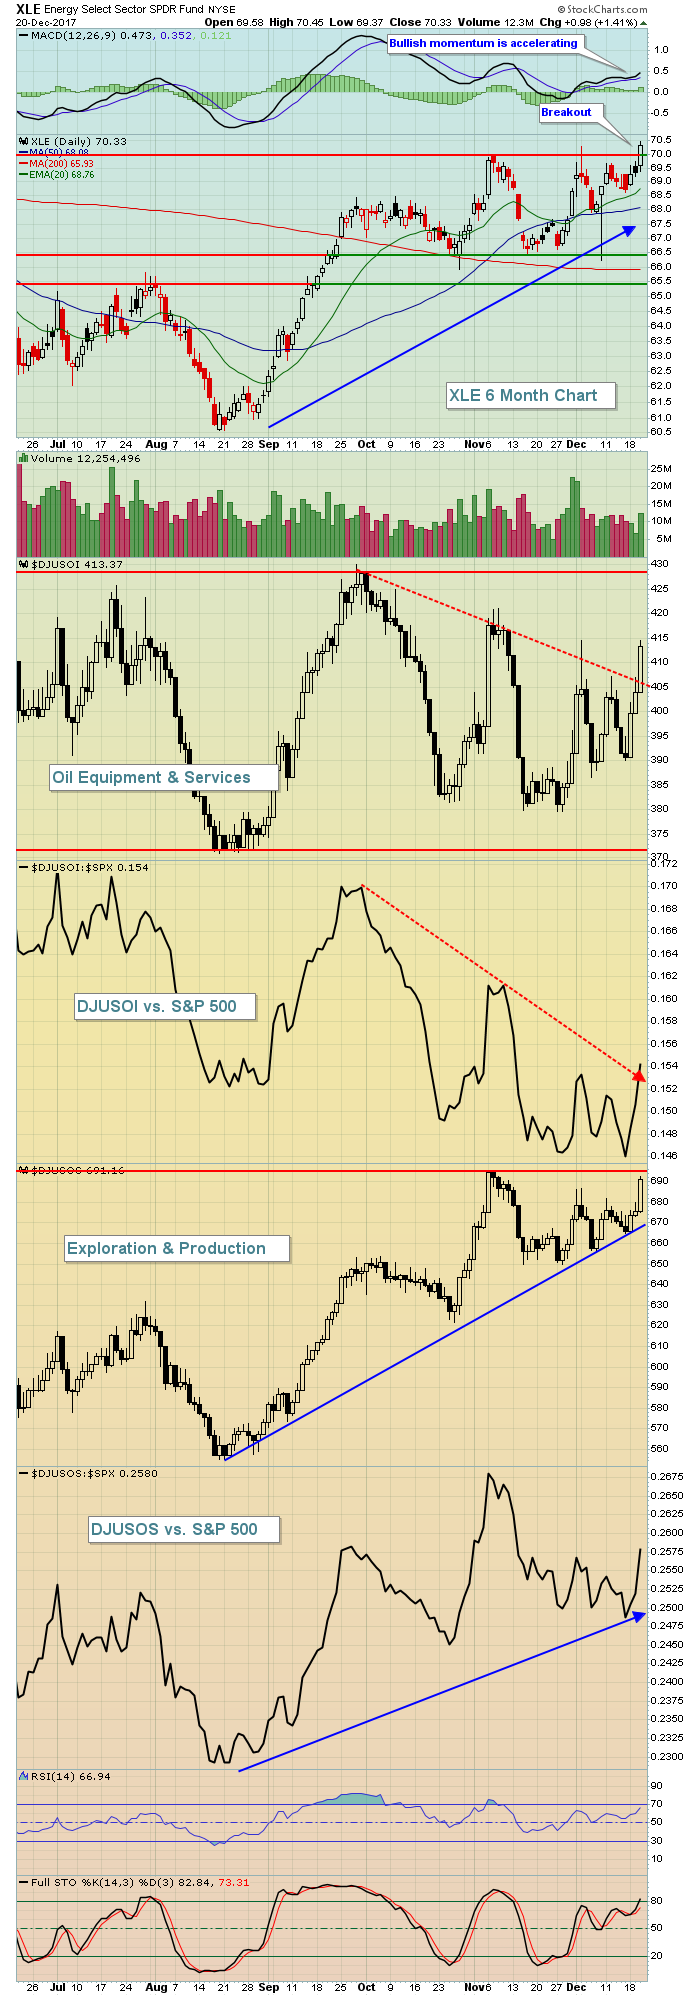 Bull market rotation simply takes turns benefiting each sector, albeit some sectors more than others. Yesterday, it was energy's turn. The DJUSOS has been a big reason why energy has reversed course. Continuing strength in the DJUSOI is likely necessary to keep it on its bullish course. The downtrend that the XLE endured throughout much of 2017 has clearly ended and bullish tendencies have emerged:
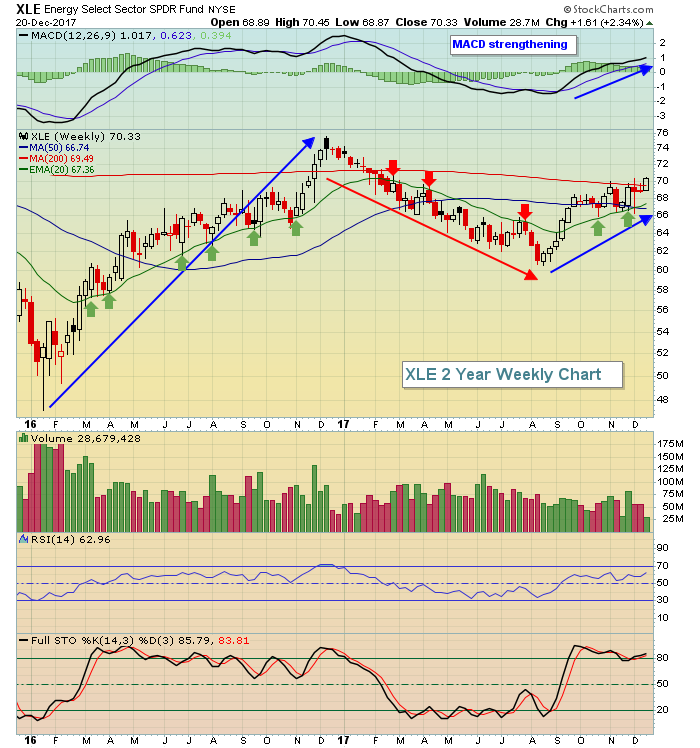 During uptrends, we typically see the rising 20 week EMA provide solid support (green arrows). During the recent downtrend, you see the opposite - the declining 20 week EMA posing a considerable wall of resistance on rally attempts (red arrows).
While energy was the bullish story of the day, most sectors (6 of 9) ended the session with fractional losses, although selling clearly hit the utilities sector (XLU, -0.79%) hardest as the rising 10 year treasury yield ($TNX) closed at 2.50% - its highest closing reading since mid-March. Rising treasury yields make dividend yields on utilities less attractive so XLU investors can't find the exit sign fast enough given the big rise in the TNX this week.
Pre-Market Action
Asian and European markets are both mixed, but that hasn't deterred buying here in the U.S. Dow Jones futures are higher by 47 points as we approach the start of a new trading day.
Current Outlook
Retail stocks (XRT) have been on fire the past six weeks or so, but bullish price momentum is beginning to show a little wear and tear as a negative divergence has printed on the recent price highs:
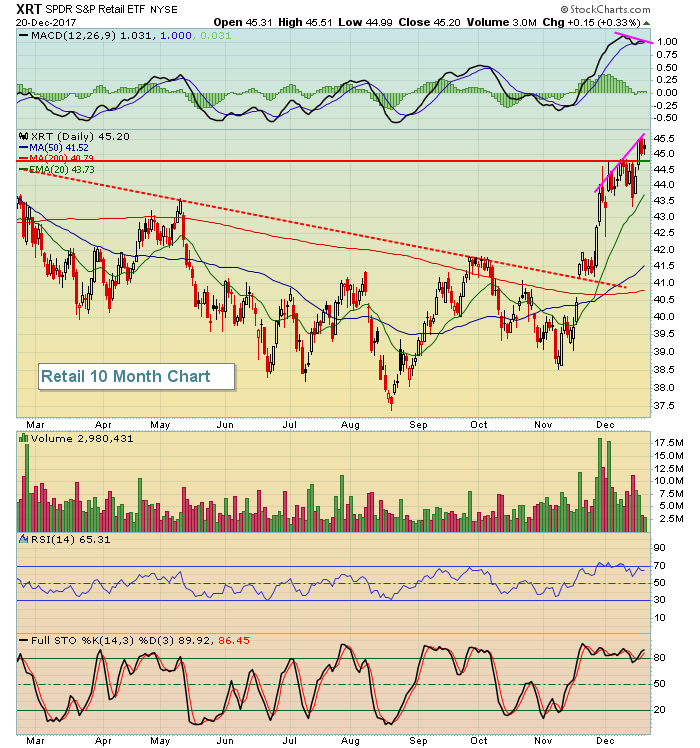 The appearance of a negative divergence doesn't guarantee we'll see a pullback. In fact, further price appreciation could result in the MACD rising to clear its recent high, thus eliminating the negative divergence. What would concern me more is if the XRT were to fall back and close beneath its recent price breakout level (now price support) near 44.75. If so, the likelihood of a further decline to unwind the slowing momentum issue grows. In the short-term, I'd remain cautiously bullish.
Sector/Industry Watch
Specialty retailers ($DJUSRS) have been quite strong and appear to be poised for a further rally based on its recent weekly ascending triangle breakout. Take a look:
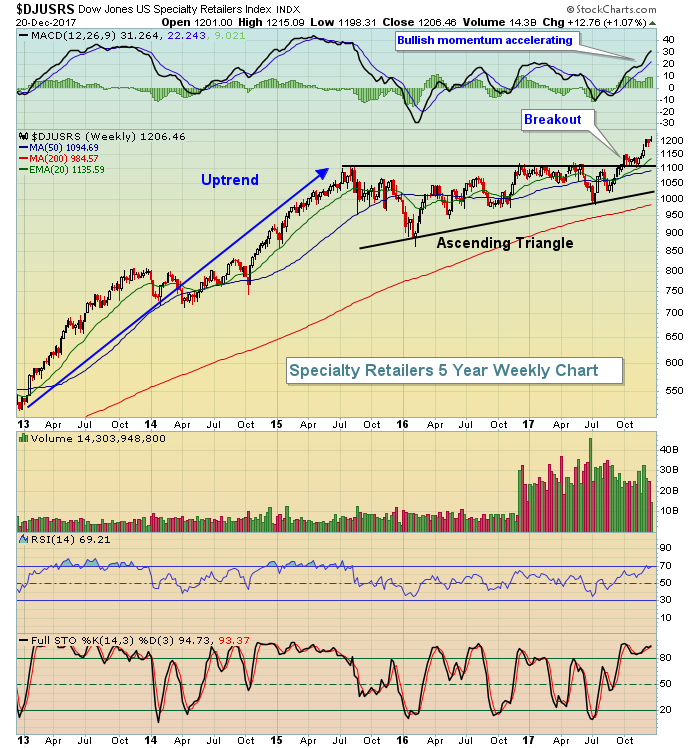 The beauty of continuation patterns is that they provide us a potential measurement and target. In this case, the top of the triangle is near 1105. The bottom of the first low is roughly 860. That provides us a measurement of 245 points upon breakout. If we add the 245 measurement points to the breakout level of 1105, we're given a potential target of 1350. The best reward to risk entry into this space would be the rising 20 week EMA, currently at 1135. Overstock (OSTK), which fell nearly 5% yesterday, has the highest SCTR (99.8) among its specialty retailer peers, with Dollar Tree (DLTR) a close second (98.8).
Historical Tendencies
I mentioned retailers (XRT) above in the Current Outlook section. The strength recently in this area of the market is quite evident, but from a seasonal perspective, we're just beginning to approach the best time of the year to invest in this group. Over the past 12 years, the XRT's best three calendar months are consecutive months - from February through April - where we've seen average monthly gains of 3.0%, 4.4% and 2.8%, respectively. That means the group has averaged rising approximately 10% over those 3 months the past 12 years. Given the recent breakout, I suspect we're looking at a very strong start to the year for retail.
Key Earnings Reports
(actual vs. estimate):
ACN: 1.79 vs 1.66
CAG: .55 vs .52
KMX: .81 vs .82
PAYX: .59 vs .59
(reports after close, estimate provided):
CTAS: 1.26
NKE: .39
Key Economic Reports
Q3 GDP final estimate released at 8:30am EST: 3.2% (actual) vs. 3.3% (estimate)
Initial jobless claims released at 8:30am EST: 245,000 (actual) vs. 234,000 (estimate)
December Philadelphia Fed business outlook survey released at 8:30am EST: 26.2 (actual) vs. 21.8 (estimate)
October FHFA housing price index to be released at 9:00am EST: +0.4% (estimate)
November leading indicators to be released at 10:00am EST: +0.3% (estimate)
Happy trading!
Tom
