Market Recap for Tuesday, December 19, 2017
Housing data released the past couple days has been extremely hot with the housing price index well above expectations and then yesterday housing starts and building permits both easily surpassing Wall Street consensus estimates. This data has been expected by the stock market as price action in home construction ($DJUSHB) leading up to these reports has been straight up. Check out the strength the past few months in the DJUSHB:
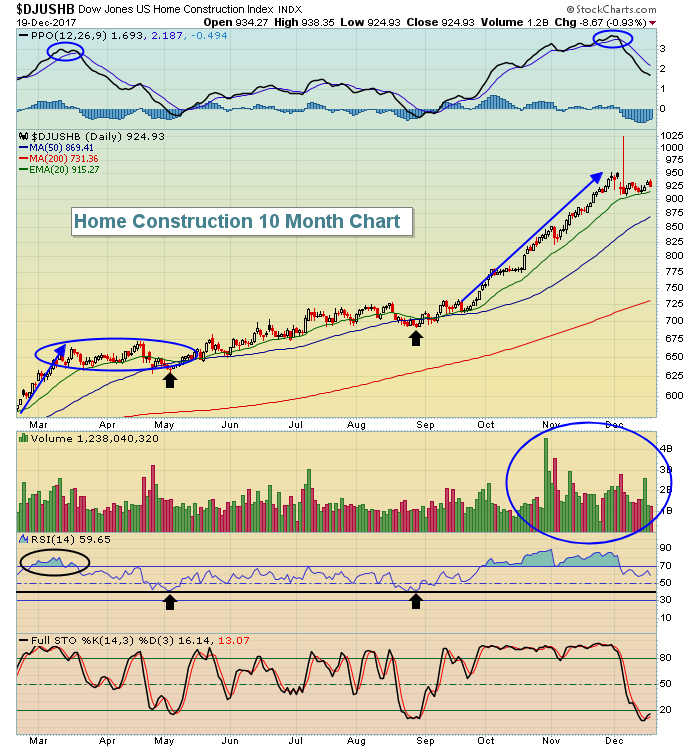 There's a lot on this chart that's relevant from a technical analysis perspective. Currently, conditions in this industry look quite similar to the March high after we saw a big move higher. Note back then that the MACD began falling and it took a couple months to relieve the overbought conditions and eventually the RSI printed a 40 reading - and marked a bottom. We're just now falling out of overbought territory on the DJUSHB and, given the drop yesterday after very good fundamental news, I suspect the "buy on rumor, sell on news" theory is in play here. The group is still very bullish technically, but may require further rotation out of the space....and more consolidation....before a more meaningful move higher should be expected.
Consumer discretionary (XLY, -0.13%) was down just mildly, but home construction was its worst performing industry group. Now that a lot of good news has been built into prices, that group could begin to frustrate those who have bought home construction stocks of late.
Utility stocks (XLU, -1.82%) and REITs ($DJR, -1.97%) were hit especially hard on Tuesday as the rising 10 year treasury yield ($TNX) pressured dividend-paying areas. Income-oriented traders and investors typically sell utilities and REITs as safer treasuries weaken and show rising yields. That was most certainly the case yesterday:
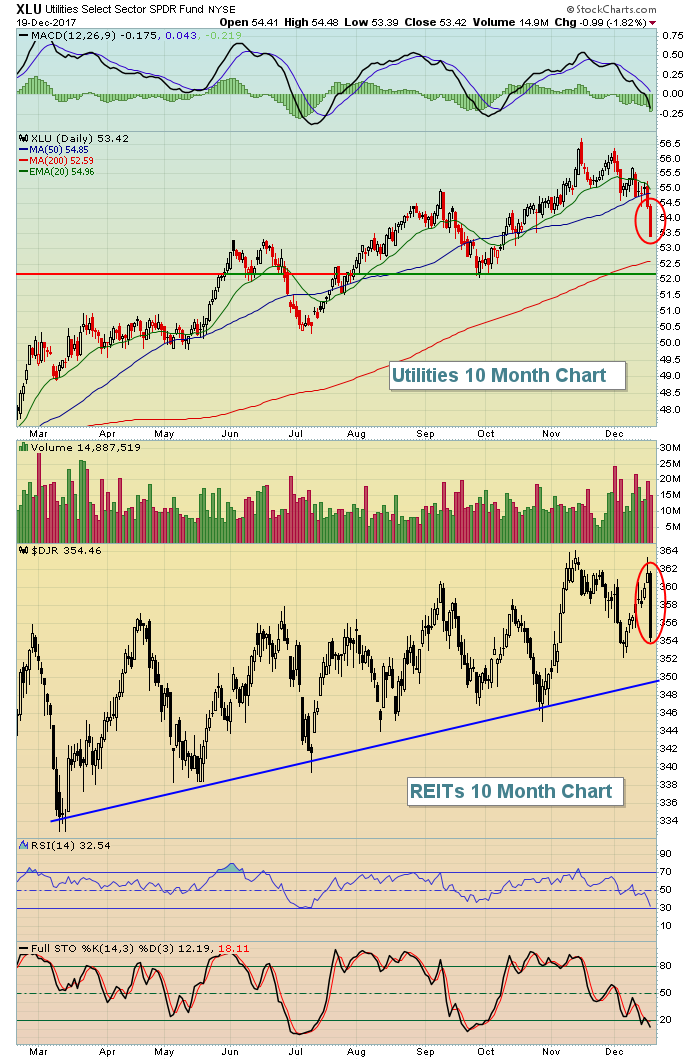 While both utilities and REITs remain in uptrends and continue to participate in the bull market, expect them to underperform the S&P 500 during periods of rising treasury yields and I expect to see these yields rise further in 2018.
Equities did reverse rather bearishly yesterday and the primary reason was the performance of the heavily-weighted technology sector (XLK, -0.61%). The FAANG stocks all finished lower on Tuesday and we saw many reversing candles on key indices ($RUT), sectors (XLF) and individual stocks. These are "potential" short-term issues for the bulls, but don't expect them to hold back prices for long - especially during the historically bullish second half of December.
Pre-Market Action
Overnight, things were quiet in Asia with most major markets there close to the flat line and mixed. In Europe this morning, we're seeing similar action. Gold ($GOLD) is up nearly 5 bucks, approaching the $1270 level, and is attempting to close higher for the fifth time in the last six sessions. There's also a big test of the declining 20 day EMA on GOLD at $1265 and this morning's gains have GOLD at $1269. Let's see if this short-term breakout can hold. Copper ($COPPER) is up 1.25% this morning and is looking to continue its recent winning streak. COPPER has finished higher in each of the past 10 trading sessions - a bullish sign for economic growth ahead.
Crude oil ($WTIC) could heavily influence the short-term action in energy (XLE) shares as the XLE is nearing critical overhead price resistance - shown below in the Sector/Industry Watch section. In pre-market action, the WTIC is up approximately 0.50% and nearing $58 per barrel.
Dow Jones futures are strong this morning, up nearly 100 points with 30 minutes left to the opening bell.
Current Outlook
Rising treasury yields are bullish for equities because it's the selling of treasuries that causes yields to rise. Why sell treasuries? Well, normally it's because our economy is strengthening. During periods of economic strength, investors/traders move away from treasuries, causing yields to rise, and the proceeds tend to be reinvested in asset classes that benefit from a strengthening economy - primarily the equity market. There's a very strong historical positive correlation between short-term advances in the 10 year treasury yield ($TNX) and performance of the S&P 500. It's the rotation of money from bonds to equities that historically fuels significant stock market rallies. With that in mind, check out this chart of the TNX:
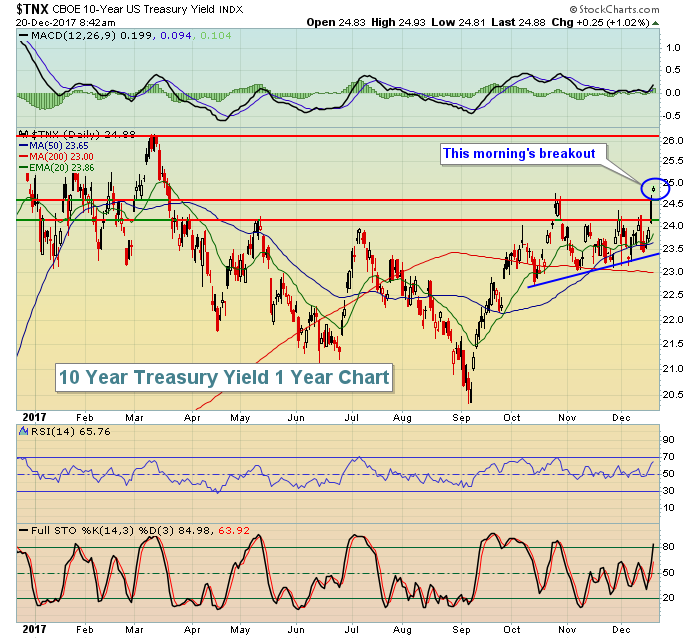 There were a number of short-term bearish indications from Tuesday's market action, namely reversing action that suggested we could see further selling in the near-term. However, rising treasury yields were not one of those bearish indications. It's quite the contrary actually as rising treasury yields are generally extremely bullish for U.S. equities. So there's a battle to take place today. My guess is the bulls will win because they almost always do during raging bull markets.
Sector/Industry Watch
Energy (XLE, +0.14%) bucked the selling trend on Tuesday and finished as the best performing sector. It may not just be a short-term victory, though, as the XLE is nearing a very significant price resistance and potential breakout:
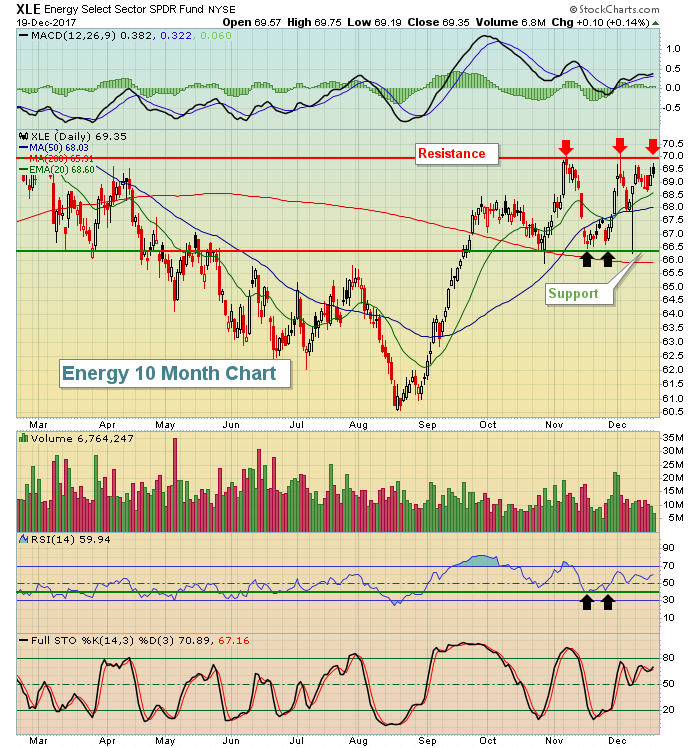 The XLE has been acting very bullishly the past few months and clearly has broken its prior downtrend. I like the fact that the XLE has been holding onto rising 20 day EMA support and that adds to the likelihood we'll see a breakout sooner rather than later.
Historical Tendencies
Recently, I highlighted the extremely bullish historical tendencies of the Russell 2000 in the second half of December. If you recall, December 19th was the only day during the second half of December that carried negative annualized returns. Also, it's important to note that the 19th calendar day of ALL months is the worst day of the month historically. The reason? It's probably the fact that it tends to fall near, on, or just after options-expiration Friday.
On the S&P 500, the 19th calendar day of all months since 1950 has produced annualized returns of -32.71%. There have been 566 such days (excluding yesterday), or the equivalent of 2+ years of trading days. The 19th has risen 270 times and fallen 296 times. So there's a slight bias to the downside in terms of percentage chance the 19th goes lower. Obviously, however, those 296 down days have tended to carry bigger losses than the gains realized on the 270 up days.
Yesterday was December 19th.
Key Earnings Reports
(actual vs. estimate):
BB: .03 vs (.01)
GIS: .82 vs .82
Key Economic Reports
November existing home sales to be released at 10:00am EST: 5,550,000 (estimate)
Happy trading!
Tom
