Market Recap for Thursday, February 8, 2018
For now, forget about the strong earnings season that we just witnessed. Also, forget about bond yields rising, which I view as a very bullish development generally-speaking as it allows money to rotate from the more defensive bond market to the more aggressive equity market. What makes rising bond yields bearish is a discussion for another day, but rising from all-time lows is not a bad thing in my view so long as it accompanied a strengthening economy.
At this exact moment, none of the above matters. It's all about the Volatility Index ($VIX). VIX readings rarely hit the levels that we've seen this week. This week's occurrence was the first since 2015 and only the second since 2011. We do have to respect this sudden increase, however, as bear markets cannot flourish without an elevated level of fear. Arthur Hill, Sr. Technical Analyst here at StockCharts, joined Erin Swenlin and me on MarketWatchers LIVE on Thursday and Art discussed the VIX at length. He considers the 20 level on the VIX to be critical and provided charts on MW LIVE yesterday to highlight that area. In my research of prior bear markets, I've found the 16-17 level to be critical. The last two bear markets continued uninterrupted with VIX support at 16-17 during market advances. When the VIX moves beneath that level, the odds of a bull market resuming increase significantly. Therefore, what the VIX does from here on market advances is what I'll be watching most closely. If the selling continues, the VIX will remain elevated because that's just what it does.
On Thursday, with the VIX surging again, all of our major indices finished with big losses. The Dow Jones, S&P 500, NASDAQ and Russell 2000 ended the session 4.15%, 3.75%, 3.90% and 2.93% lower, respectively. The Russell 2000 may finally be getting a break on a relative basis due to the rising dollar in February:
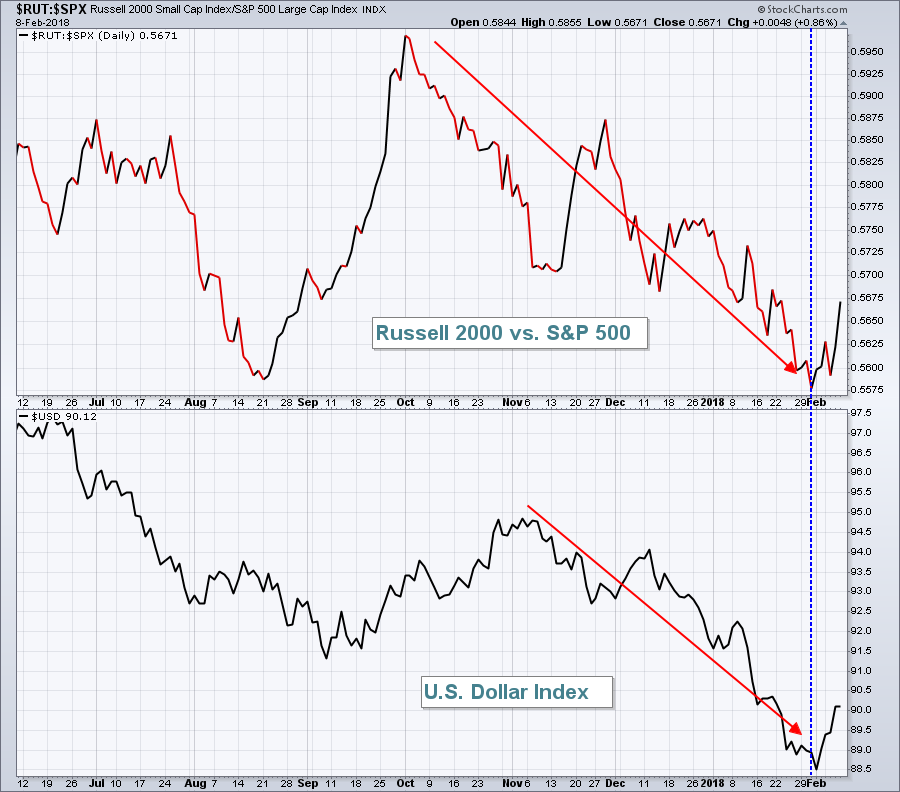 The dollar began showing strength in February and the Russell 2000's relative weakness vs. the benchmark S&P 500 ended simultaneously. A falling dollar benefits the multinational companies found on the S&P 500, so the recent rebound in the dollar has triggered more violent selling of those multinational companies.
As for sectors and industry groups, the action on Thursday was about what you might expect. The selling hit all areas. All nine sectors finished lower with the more aggressive sectors seeing relative weakness. Financials (XLF, - 4.40%) and technology (XLK, -4.14%) were the worst sectors. In a true measure of selling strength, every industry group finished lower on Thursday.
THAT is a concerted selling effort and this high volatility environment MUST be respected. This ain't your normal pullback.
Pre-Market Action
Stocks remain quite volatile - even in pre-market action - as we've moved from higher futures.....to lower futures....back to higher futures again. Where we open is anyone's guess, but currently, Dow Jones futures are pointing to a fractional move higher.
Asian markets were down mostly in the 2-4% range overnight. Selling continues in Europe as well with the German DAX ($DAX) now approaching 12000 for the first time since early-September. The 11900-12000 support level on the DAX is a very significant support level. Given that the DAX and S&P 500 tend to move in unison over time, you should at least be aware of that approaching support level.
Current Outlook
The Volatility Index ($VIX) continues to rule the action. During three of the last four days, we've seen intraday moves of at least 1000 points on the Dow Jones. On Monday, we saw the Dow fall more than 1500 points in less than five hours, rally back 900 points in 20 minutes, then fall another 400 points into the close. On Tuesday morning, U.S. equities gapped lower, then the bulls had a turn, rising nearly 1000 points in 20 minutes again. By the close on Tuesday, the Dow Jones had risen more than 1100 points off the early morning low. A bit of sanity returned to the stock market on Wednesday with a trading range of "only" 500 points. That brings us to yesterday, where we saw a steady stream of selling throughout the session with a loss of more than 1000 points.
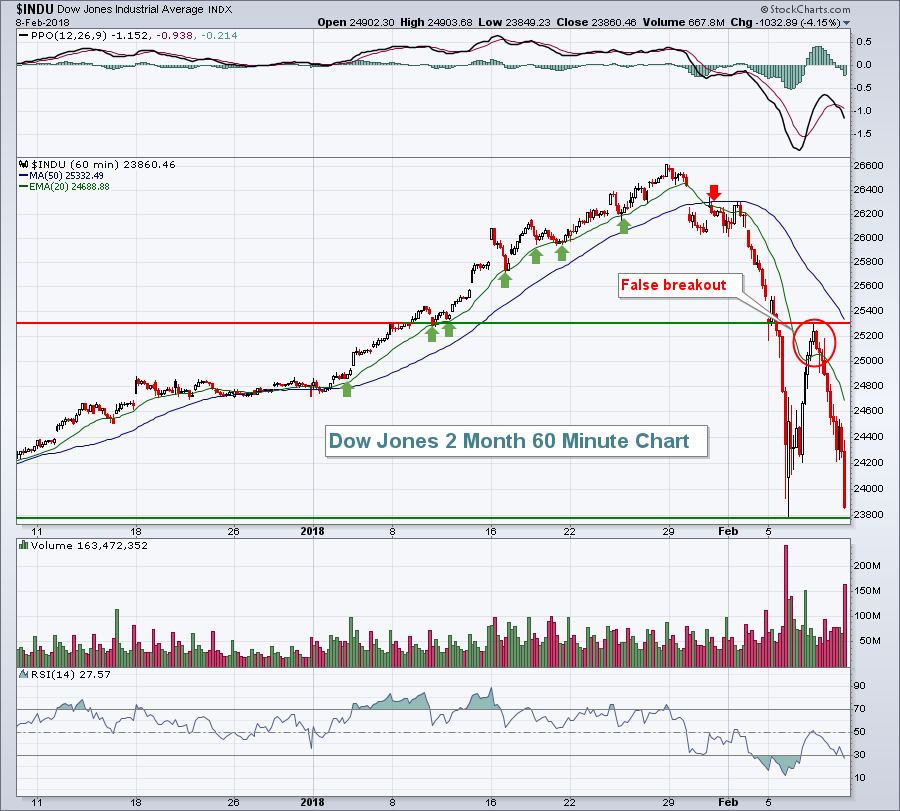
What this tells me is that emotions are controlling the market right now. It's a clear battle between greed and fear, with fear holding the upper hand as the market opens on Friday. We can throw rational behavior right out the window. For short-term traders, you might consider using the 20 hour EMA as a gauge for being long or short the market. It gave one false signal on Wednesday, so you have to be prepared to take quick losses, but I expect that eventually we'll move back above that key moving average and hold. Here's the current hourly chart on the Dow:
 Above all else, we have to keep in mind that we're dealing with a market environment with a VIX reading at extremely high levels. This type of market does not act rationally. Wild swings can be expected to occur when we least expect them. Those who have a habit of chasing moves could experience very large losses. Therefore, those with low risk tolerance should consider waiting for stabilization before trading/investing. Those with higher risk tolerance levels, willing to take chances on short-term bottoms and tops, must realize they're now sailing on the high seas. I'd be careful with position-sizing and trading leveraged ETFs. While returns can be substantial if you guess correctly, don't ignore the other side of the equation - risk.
Sector/Industry Watch
I'm trying to pick my spots for long entry into sectors and industries and I'm doing it in increments to help to limit risk. February through April is a strong seasonal period for retail (XRT) and it's a group that struggled with a negative divergence on its daily chart as we set new highs in January. While the recent global selling has resulted in some technical breakdowns, the XRT is an area holding up fairly well on a relative basis. Check out the weekly chart on the XRT:
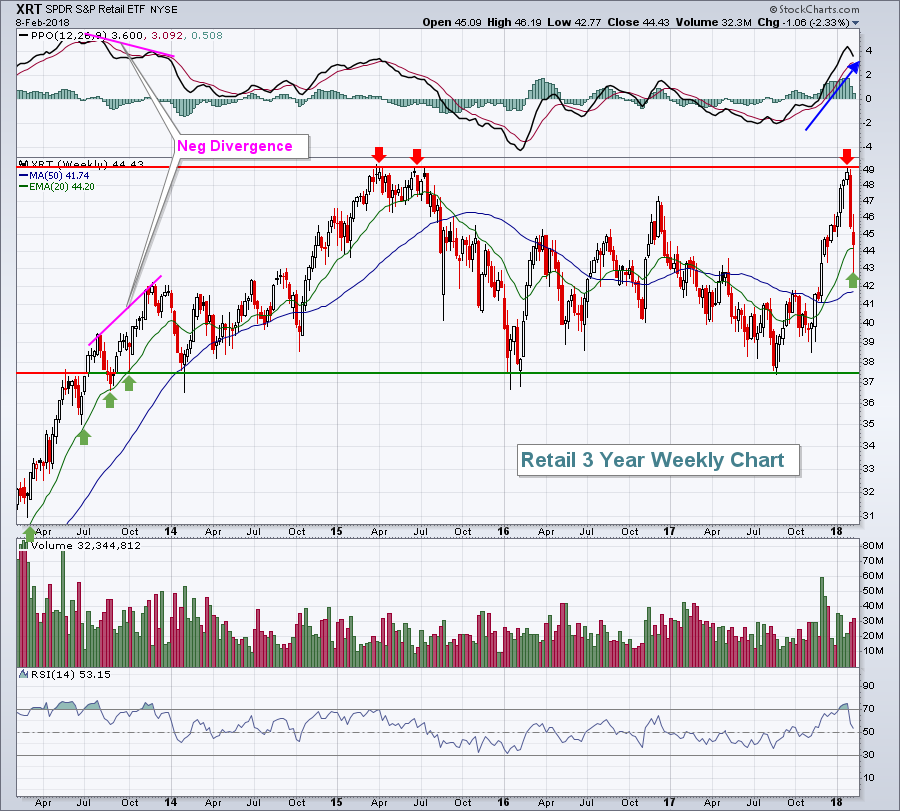 Here's the question on retail. Did the recent top at price resistance (49.00) end the current uptrend or is it simply a pause to unwind the negative divergence on the daily chart? If you look back into 2013, the last time the XRT was trending higher, we saw multiple "kick saves" at the rising 20 week EMA until a negative divergence printed in late-2013. Currently, there is no negative divergence with the PPO rising to a new high on the latest price high. I'd like to see that rising 20 week EMA, currently at 44.20, hold at today's close. A final line in the sand short-term would be the low earlier this week at 42.77. Let's see if retail can hold support during this volatile market period.
Historical Tendencies
Well, the bears will have one historical tendency on their side today. It's the 9th calendar day of the month. The 9th has produced annualized returns of -19.82% since 1950 on the benchmark S&P 500. The 19th is the only calendar day that produces worse annualized returns on the S&P 500.
Keep in mind this is a tendency, not a guarantee of lower prices. It should also be noted that over the past 67 years, the S&P 500 has risen on the 9th more often than it declines. Clearly, however, the average losses on down days are more significant than the average gains on up days.
Key Earnings Reports
(actual vs. estimate):
CBOE: .87 vs .88
MCO: 1.51 vs 1.45
VTR: 1.03 vs 1.03
Key Economic Reports
December wholesale trade to be released at 10:00am EST: +0.2%
Happy trading!
Tom
