Market Recap for Wednesday, March 7, 2018
It was a day of bifurcation, but it was good bifurcation - if that makes any sense. When the stock market jury is split as we saw on Wednesday, I prefer that our aggressive market areas perform well and defensive areas lag. Well, the very aggressive small cap Russell 2000 ($RUT) was the leading index, gaining 0.79% on the session. The NASDAQ rallied 0.33%. The more defensive benchmark S&P 500 nearly completed its intraday comeback attempt, finishing down just 1 point (after being down 26 points, or nearly 1% earlier in the day). Finally, the Dow Jones Industrial Average, comprised of 30 behemoth companies, was the worst performer, losing 83 points. However, like the S&P 500, the Dow rallied some 260 points off its intraday low, trimming most of its earlier losses.
From a sector perspective, technology (XLK, +0.55%) was the top group. Interestingly, while the S&P 500 has had a 3% trading range over the past week and the Volatility Index ($VIX) has moved in a 17.52-26.22 range, only one sector has moved up or down more than 1%. Wanna take a guess? Yep, technology with a 1.07% gain. So while we've seen a ton of whipsaw in the market, there's been little change in terms of sector performance. The S&P 500 has gained roughly 0.50% in each of the past two weeks. The stock market is stabilizing, building a base and the VIX is moving much closer to a level (below 16) not seen at any point during the past two bear markets. The VIX closed on Wednesday at 17.76.
Specialized consumer services ($DJUSCS) made a bullish cup with handle breakout on Tuesday's close and the strength continued on Wednesday. Check out this chart:
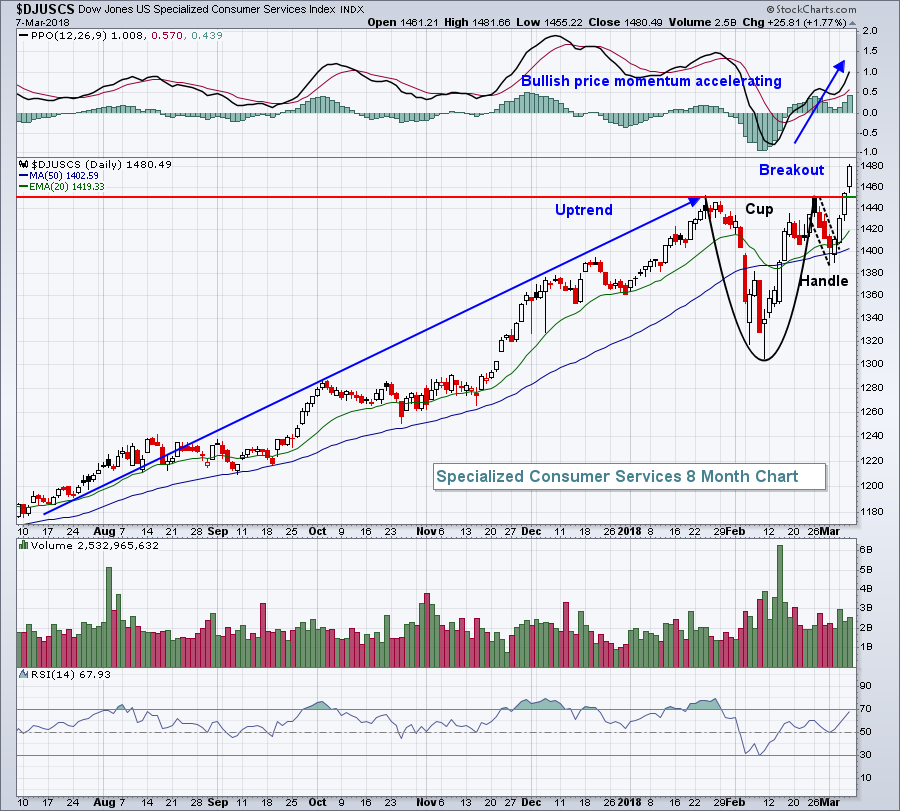 This is text book. There's a prior uptrend in play. The cup forms over about a four week period. A downtrending handle prints and bottoms at the rising 20 day EMA. Then volume increases to support a breakout above the double top. The measurement here - from the top of the cup to the bottom - is roughly 145 points. The eventual target - breakout point plus measurement - would be close to the 1600 level. A few leaders in this space are Match Group, Inc. (MTCH, breakout, SCTR 98.5), MercadoLibre, Inc. (MELI, breakout, SCTR 97.0), Etsy, Inc. (ETSY, breakout, SCTR 96.7), and Copart, Inc. (CPRT, breakout, SCTR 95.9). A more familiar name included in this industry group is eBay, Inc. (EBAY, strengthening, SCTR 82.2).
Pre-Market Action
In a $54 billion deal, CIGNA (CI) has agreed to acquire Express Scripts (ESRX). That should provide a lift to areas within healthcare (XLV) today.
Asian markets were mostly higher overnight and Europe is mixed. Dow Jones futures are higher by 28 points (+0.11%), although the NASDAQ futures are up much more solidly at 0.56%. The 10 year treasury yield ($TNX), gold prices ($GOLD) and crude oil ($WTIC) are all fairly flat in early action today.
Current Outlook
The Dow Jones U.S. Railroads Index ($DJUSRR) is generally a solid barometer of expected economic strength domestically. I don't know of too many railroad cars delivering goods to parts of the world outside North America. If our perceived economic strength ahead is solid, railroad stocks tend to portray that future strength with rising prices. Greg Schnell joined MarketWatchers LIVE on Tuesday and discussed the importance of watching the railroads closely and I agree with him. Railroads are just one piece of the stock market puzzle, but clearly a breakdown in this group would be a warning sign. Now the term "breakdown" is a subjective one. Here's the chart I'd be watching on railroads:
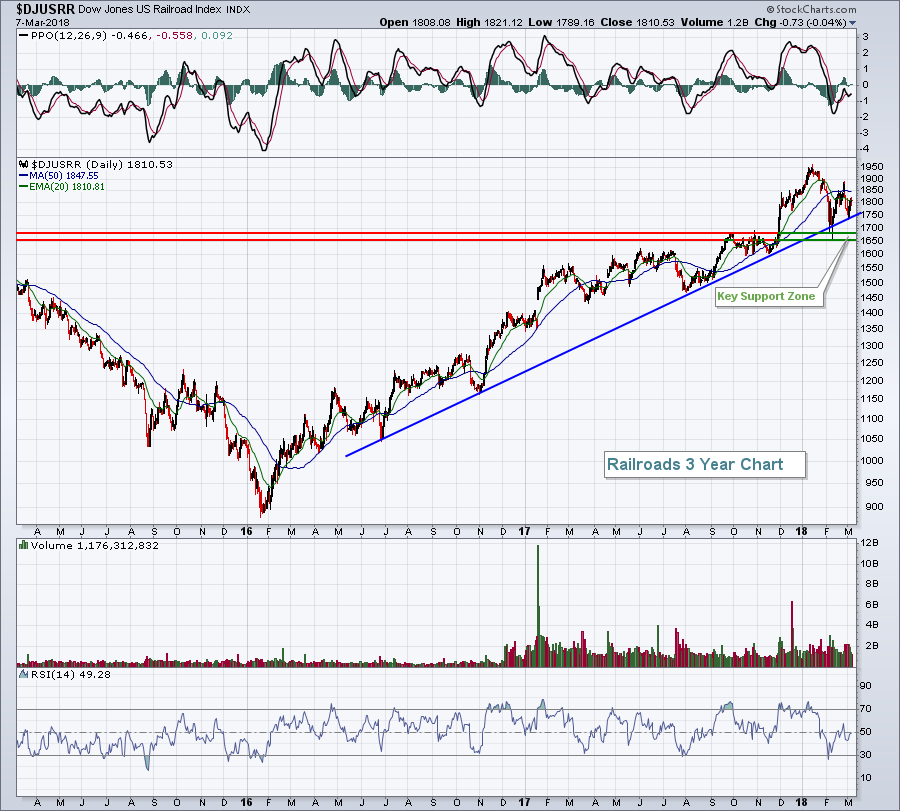 A break of trendline support (rising blue line) would be significant, but trendlines can be very subjective. For instance, if I connected "intraday" lows, the slope of this line would not be as steep and currently might intersect the 1700 level instead of 1750. So, for me, it's all about the price support zone that resides just beneath trendline support. If that goes, then everything goes! Price support was established at two levels. The first was when price resistance was broken in late-November 2017 near 1680. "Broken price resistance becomes price support" (Technical Analysis 101). The second support level was established during our panicked February selloff when the DJUSRR fell to 1650 before quickly rebounding. I believe the biggest level on this chart is now at 1650 and a close beneath it would raise a significant red flag.
I don't see the DJUSRR returning to that level near-term. Instead, I'm expecting the current bull market uptrend to hold and the DJUSRR to move to new highs sooner rather than later.
Sector/Industry Watch
Over the past month, the Dow Jones U.S. Steel Index ($DJUSST) has risen 11.53%, the best performance among all industry groups over that span. Of course, all the talk about tariffs on steel imports have the U.S. based steel companies soaring - and probably a bit overdone in the near-term. But do you have any idea of the next best performing industry group? I was a bit surprised when I realized it was the real estate holding & development index ($DJUSEH). The DJUSEH has gained 11.05% over the past month. The surge is quite notable technically, because it clears overhead resistance near the 105 level. The DJUSEH is now at a bull market high and very close to an all-time high. Here's the longer-term weekly chart:
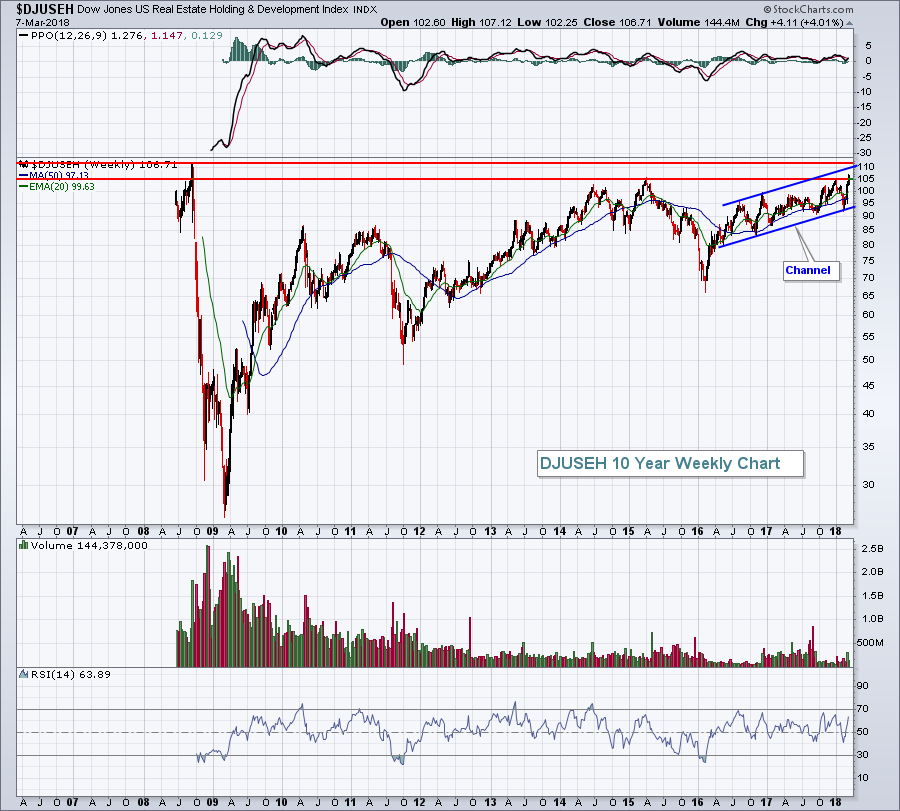 Breaking out during the recent volatile action suggests excellent relative price action. The index moves nearly in lockstep with Howard Hughes Corp (HHC). While HHC is overbought currently, a pullback to test its rising 20 day EMA would be reason for consideration.
Historical Tendencies
The NASDAQ has been outperforming the S&P 500 for much of the past two years, but it's worth noting that this streak could be in danger - at least historically. Over the past 20 years, the NASDAQ has underperformed the S&P 500 during three calendar months, two of which are consecutive calendar months - March (-0.4%) and April (-0.6%). This does not mean that the NASDAQ has a history of moving lower these two months. It simply means that, on average, the NASDAQ produces average returns during March and April that fall short of the S&P 500's average returns by 0.4% and 0.6%, respectively.
To soften the blow a little, the NASDAQ has outperformed the S&P 500 12 times in the last 20 years in March, or 60% of those years. Obviously, the problem is likely that when it underperforms, it really underperforms. Last year, the NASDAQ outperformed the S&P 500 in both March and April and will be looking to extend their relative winning streak in 2018. Thus far, the NASDAQ bulls are off to a great relative start.
Key Earnings Reports
(actual vs. estimate):
DVMT: vs 1.65 (awaiting results)
KR: .63 vs .63
(reports after close, estimate provided):
COO: 2.52
MRVL: .31
Key Economic Reports
Initial jobless claims released at 8:30am EST: 231,000 (actual) vs. 220,000 (estimate)
Happy trading!
Tom
