Market Recap for Monday, March 12, 2018
While we saw bifurcated action on Monday, it was still mostly bullish action. For starters, the more aggressive NASDAQ (+0.36%) and Russell 2000 (+0.25%) finished in positive territory while the safer indices - Dow Jones (-0.62%) and S&P 500 (-0.13%) - lagged. It was mostly positive action from a sector perspective as well. Granted, utilities (XLU, +0.43%) was the best performing sector as the 10 year treasury yield ($TNX) continued to meander in consolidation mode. But there was strength in aggressive sectors too as both consumer discretionary (XLY, +0.33%) and technology (+0.31%) joined the XLU atop the sector leaderboard. Industrials (XLI, -1.24%) struggled for exactly the same reason that the Dow Jones did - Boeing (BA). BA is the largest component in the XLI and is one of 30 components of the Dow Jones. Although BA fell nearly 3% on Monday, I believe it's setting up as a major buy:
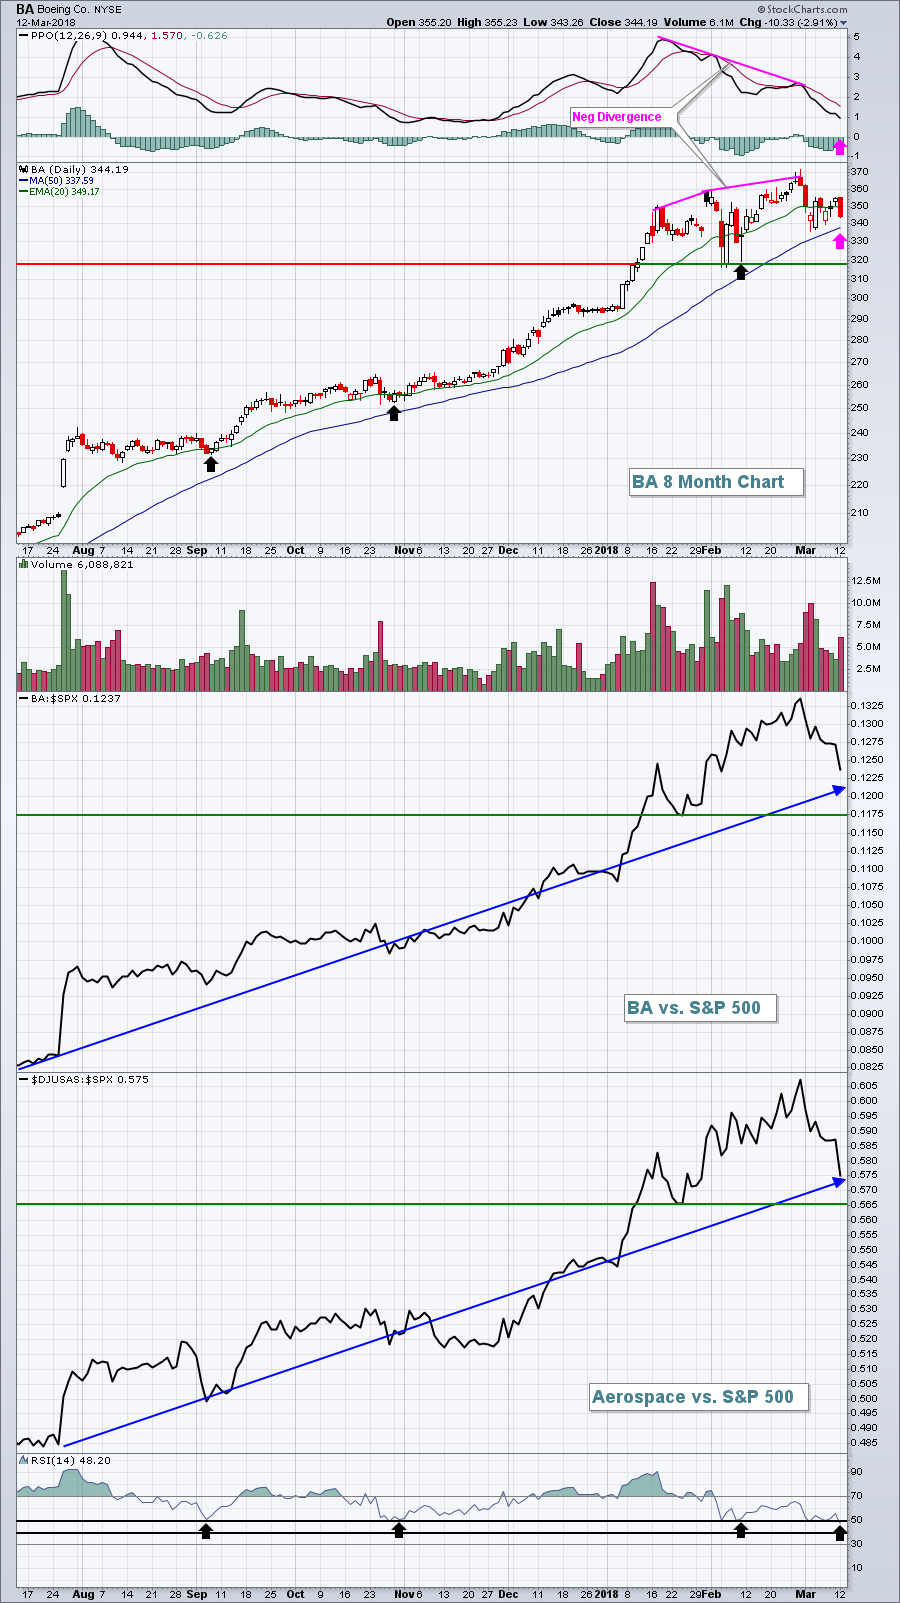 BA has been one of the best performing stocks over the past several months. They will very likely report blowout quarterly results next month. But every stock runs out of momentum from time to time and that's what BA has done. It needs a little time to catch its breath before resuming its powerful uptrend. The negative divergence suggests we'll see 50 day SMA and/or PPO centerline tests (pink arrows) and I believe that'll represent a great opportunity for entry. I'd consider the 50 day SMA, currently at 337.59 down to its recent low candlebody near 318 to be an "accumulation zone". Furthermore, check out the relative strength charts, BA:SPX and DJUSAS:SPX. The recent relative weakness is presenting an opportunity for entry into one of the strongest stocks in the U.S.
Finally, look at BA's RSI. Each of its prior trips to 50, or just below, represented a very strong buy. With yesterday's weak action, BA's RSI dipped to 48. The RSI 40-50 zone typically presents excellent entry opportunities into an uptrending stock.
The XLY was very strong on Monday, but it still must negotiate overhead price resistance at 107. That level was tested yesterday, but we need to see a close above it. The strength that I continue to look for among several industry groups within discretionary, namely autos, home construction, media agencies, broadcasting, retail, etc., depends largely on the XLY clearing 107:
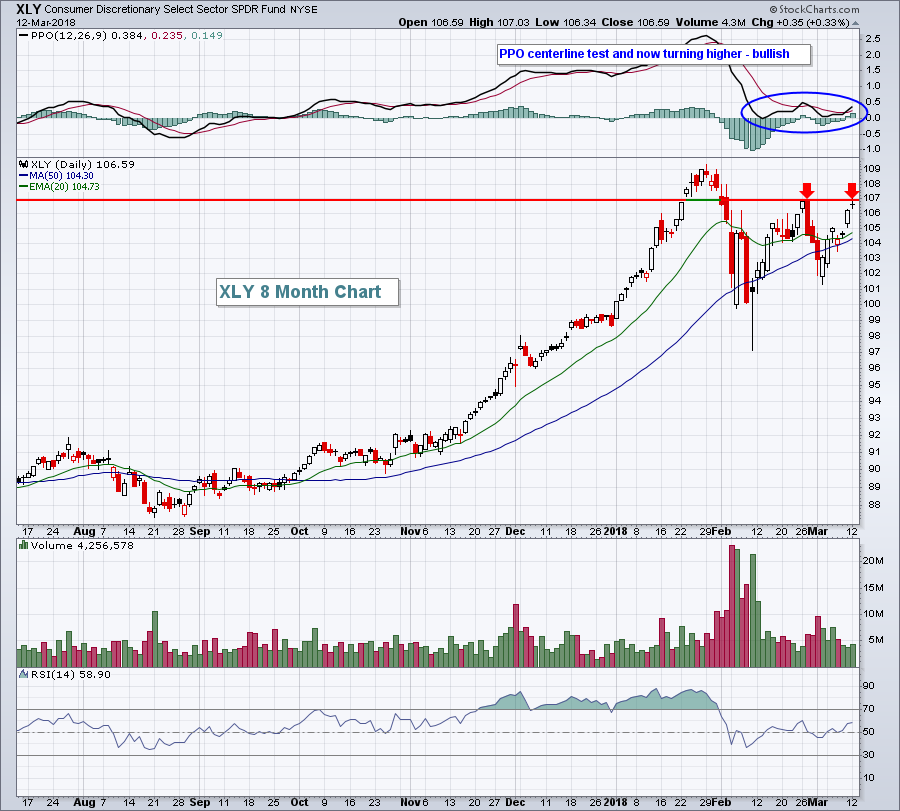 The PPO is showing accelerating bullish price momentum so a price breakout above 107 would confirm this signal. Discretionary stocks were leaders late in 2017 and into early 2018 on the heels of a strengthening retail group. The breakout above 107 would likely result in further rotation into retail and other areas of discretionary stocks.
Pre-Market Action
Traders were relieved in pre-market action as February inflation data (CPI) came out as expected at +0.2%. Futures climbed with the Dow Jones looking to start more than 100 points higher as we approach the opening bell. Bonds were back in favor as the 10 year treasury yield ($TNX) dipped 3 basis points to 2.84% on the news. The TNX has been range-bound between 2.80% and 2.95% and I'm looking for this behavior to continue in the near-term.
Global markets were mixed overnight in Asia and are mixed this morning in Europe.
Current Outlook
The recent strength in the U.S. Dollar Index ($USD) has put further pressure on the price of gold ($GOLD). To consider for an investment, I like to look at a number of technical signs and indications, including relative performance to the benchmark S&P 500. After all, as a trader, why am I doing this if I can't beat the benchmark index? If I fail to beat this index over time, I'd be much better off putting my money in the SPY and playing golf every day, right?
Gold simply hasn't been able to muster up much relative strength since 2011. Take a look at this relative chart and tell me why you'd want to consider investing in or trading gold:
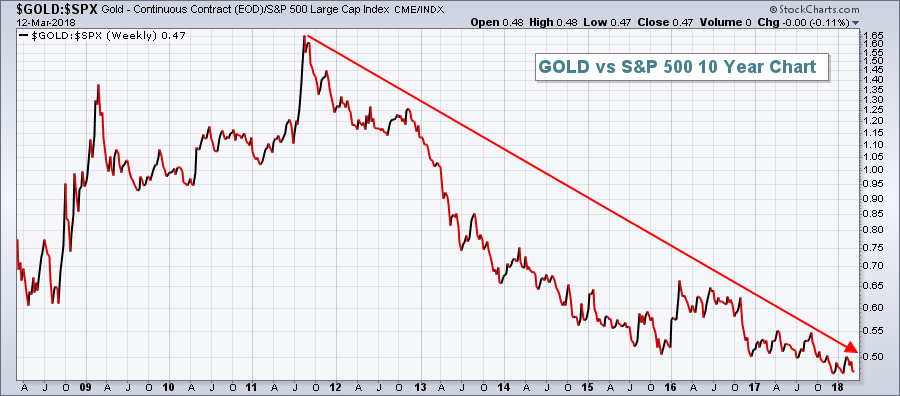 Outside of one solid surge in gold in early 2016, how can you beat the S&P 500 trading this metal?
The worst part here is that gold struggled in 2017, during a year in which the USD tumbled. There's a very strong inverse relationship between GOLD and the USD that dates back many years. Even the USD dropping 13% in 2017 couldn't produce relative strength in GOLD. And now we're seeing the USD begin to strengthen off its recent double bottom:
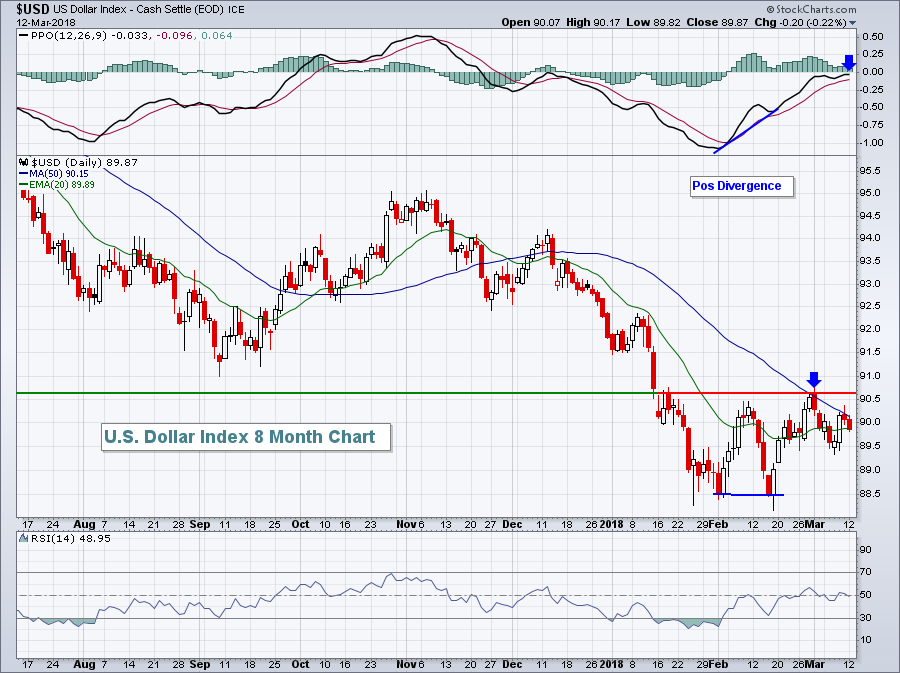 The positive divergence that printed on the mid-February low alerted us to the likelihood of at least short-term strength and a 50 day SMA/PPO centerline reset. The blue arrows highlight both of those occurrences. Now we sit back and wait to see whether this positive divergence marks a long-term bottom. If the USD can close back above the 90.75-91.00 level, I'd expect to see two important repurcussions. First, look for further deterioration in the GOLD:SPX ratio, meaning avoid gold. A second likely effect would be continuing outperformance in small caps ($RUT) vs. the larger cap, multinational S&P 500. A rising dollar hurts the profits of multinational companies. The S&P 500 benefited from the falling dollar in 2017, but the opposite could be true in 2018.
Sector/Industry Watch
Yesterday, I featured home construction ($DJUSHB), discussing the positive divergence that had formed on the heels of its recent underperformance. Today, I want to discuss autos ($DJUSAU) for the same reason. Over the past three months, the DJUSAU and DJUSHB have posted the worst results among consumer discretionary industry groups, falling 7.80% and 7.13%, respectively. But let's keep in mind that money rotates in bull markets and positive divergences are suggesting it's time to see money rotate in both of these groups. Yesterday, these two groups finished 1st (autos) and 4th (home construction) among the 23 industry groups in consumer discretionary. I see this strength continuing in the near-term. Take a look at the DJUSAU chart, along with Tesla (TSLA), one of Monday's leaders:
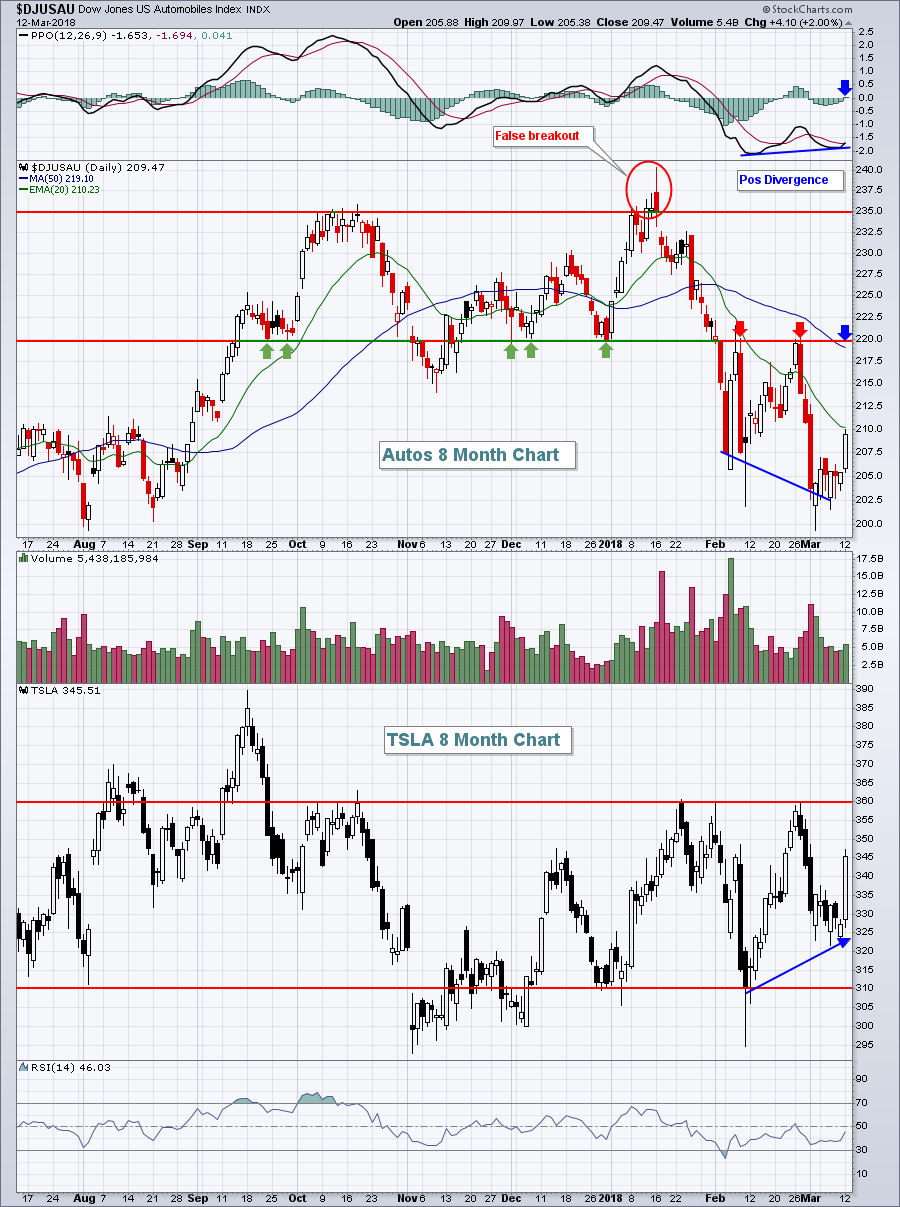 The 220 level has come into play many times over the past 8 months. The red arrows mark where it's been price resistance. The green arrows mark price support. Finally, the blue arrow marks price resistance and the 50 day SMA (also a PPO centerline "reset")- a level I'd expect to see tested after a positive divergence prints.
TSLA shows a relative strength positive divergence as it rose from the early-February low to the early-March low, while its peers were drifting lower. Should autos continue rising, as I suspect they will, look for TSLA to reach and test overhead price resistance at 360. A breakout above that level on increasing volume would be quite bullish.
Historical Tendencies
March has historically been a very kind month for small caps. As I've previously discussed here in Trading Places, March has been the second best calendar month for the Russell 2000, trailing only December (+34.08%). Many times we'll see "first half of month" or "second half of month" outperformance, but with the Russell 2000, both the first and second halves of March have been equally impressive. Take a look:
March 1-15: +19.07%
March 16-31: +21.85%
We've seen recent outperformance by the Russell 2000 vs. the benchmark S&P 500. That's at least in part due to a strengthening dollar ($USD), but there's also a seasonal propensity for small caps to perform well from February through May.
Key Earnings Reports
(actual vs. estimate):
HDS: .49 vs .44
Key Economic Reports
February CPI released at 8:30am EST: +0.2% (actual) vs. +0.2% (estimate)
February Core CPI released at 8:30am EST: +0.2% (actual) vs. +0.2% (estimate)
Happy trading!
Tom
