Market Recap for Monday, April 30, 2018
Monday was a "rinse and repeat" session from Friday. We opened higher, sold off for 90 minutes, then consolidated the balance of the day. Since Thursday's close, the NASDAQ has fallen 0.75%, but it seems like much more because both days started off so bullishly. Here's a very short-term 5 day, 10 minute chart to illustrate the action:
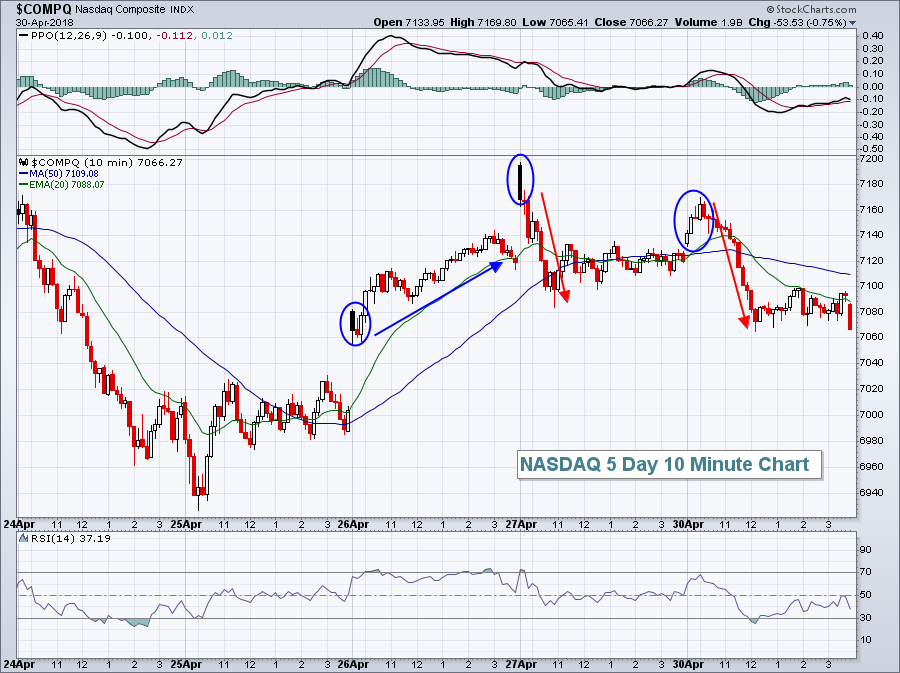 Solid earnings have been triggering early bullish action, only to be met by willing sellers. As a result, we finished yesterday almost exactly where we started on Thursday's gap higher.
All nine sectors lost ground yesterday, but energy (XLE, -0.01%) held up the best. Energy was the weak link on Friday. Healthcare (XLV, -1.53%) was hit the hardest as recent strength failed as the XLV hit overhead gap resistance:
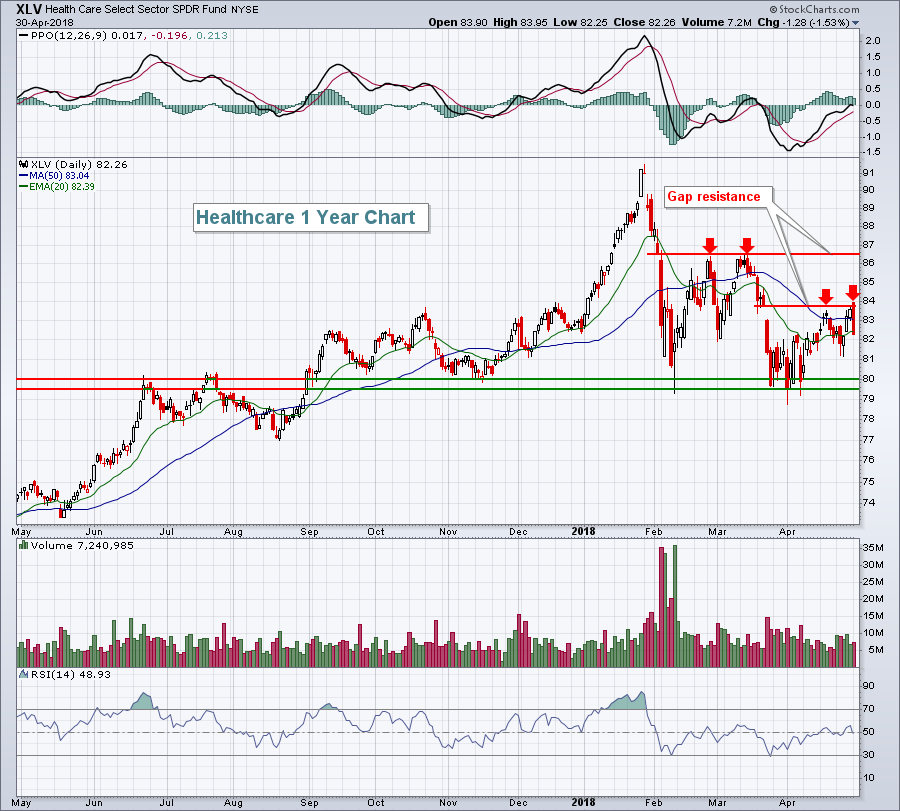 It's rather apparent that the XLV needs to negotiate gap resistance. There have been multiple failures. In the meantime, the bulls will be looking to hold price support in the 79-80 area on any further weakness.
Industrials (XLI, -1.33%) were also quite weak, but there was some good news as truckers ($DJUSTK, -0.38%) were the best performing industry group in the sector and, thus far, are holding onto key price support:
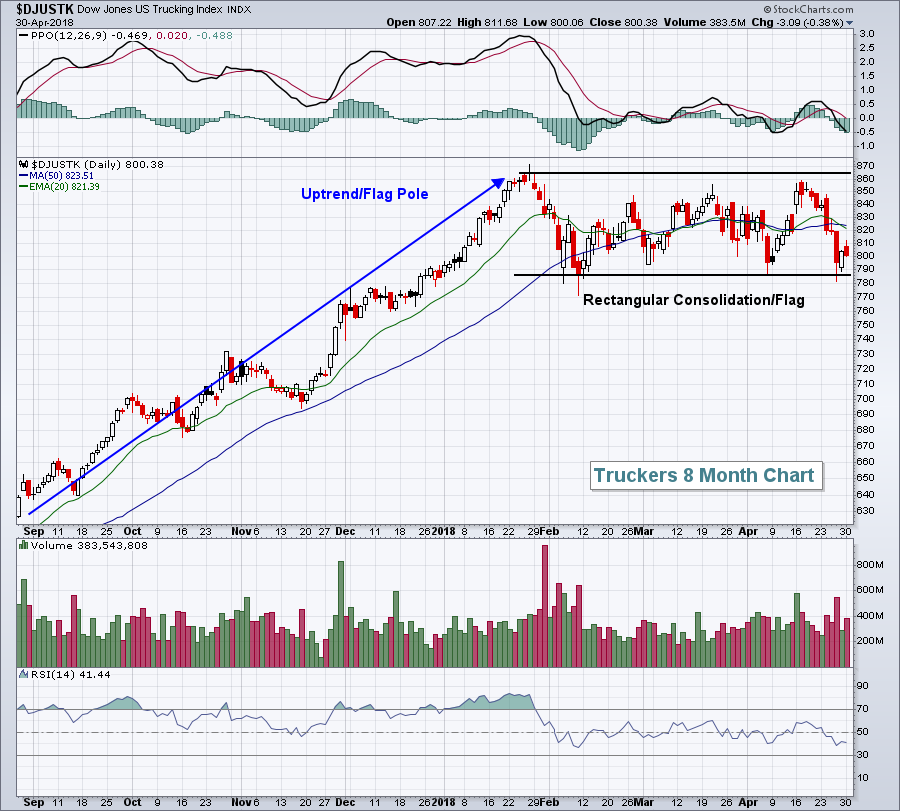 Given all the back and forth, consolidating action that we've seen since January, my trading strategy has changed to look for uptrending groups like truckers that are at or near key support. The reward to risk in these areas are solid, but you need to be willing to take profits on bounces as many advances last no more than 1-2 weeks.
Pre-Market Action
The U.S. Dollar ($USD) has been moving solidly higher over the past two weeks, with the USD at its highest level since early 2018. That strength has resulted in very weak gold prices ($GOLD) and gold miners (GDX) and junior gold miners (GDXJ). The strengthening dollar hasn't, however, hurt overall commodities as the CRB Index ($CRB) has been moving higher with the dollar. The reason? Crude oil prices ($WTIC). Energy is a major component of the CRB and energy responds more to global demand than it does the rising dollar. The dollar is a headwind for energy, but not like it is for gold. If the global economic strength intensifies, which I believe it will, then look for crude oil prices to rise along with the dollar.
Global markets are rallying, but that isn't translating into much strength here in the U.S. this morning. Typically, the 1st day of calendar months is quite bullish, but traders will be pressured to prove it for May during the trading day because prices are slightly lower as we head into a fresh new trading day. With 30 minutes left to the opening bell, Dow Jones futures are lower by 38 points.
Current Outlook
By my count, and since mid-February, we've seen the S&P 500 move above or below its 20 day EMA twelve times. By contrast, a trending market tends to see the 20 day EMA serve as a solid support area. For example, the uptrend from late-August through January only saw the 20 day EMA breached one day. We are clearly trading a different market right now. Last week, I pointed out a resistance zone on the S&P 500 that we needed to clear. We tested it, but could not break through. I would remain cautiously optimistic until that resistance is broken. Here's a reprint of that earlier chart:
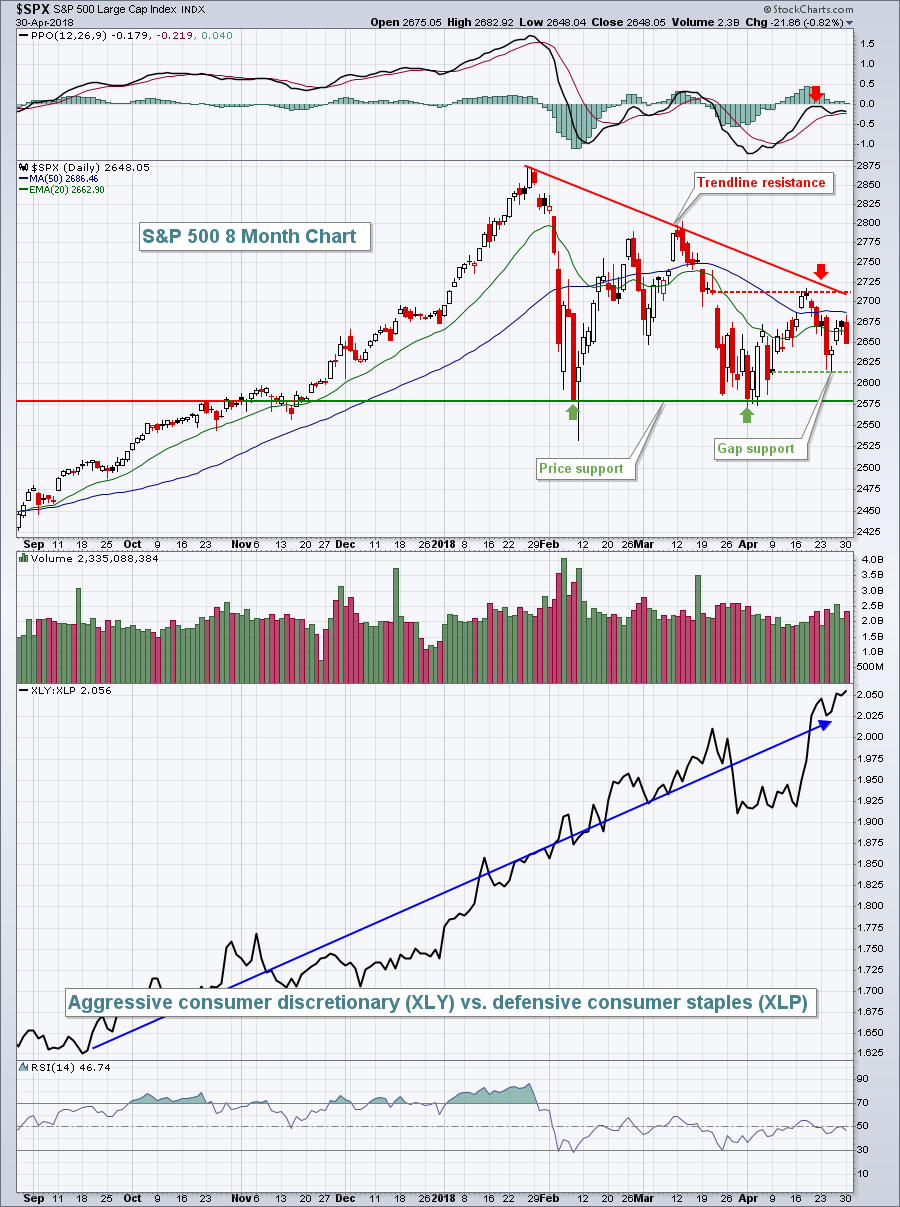 If there's good news, it's that the trading range is narrowing and we'll likely have an intermediate-term answer soon as to whether this correction is nearly over or if it is likely to last much longer. A close above 2715 would be short-term bullish, while a break below 2581 on a close would provide a fresh lift for the bears. Note that the XLY:XLP ratio continues to set new highs so if the market is preparing for a bear market, you'd never know it by looking at the performance of consumer stocks.
Sector/Industry Watch
It's not often that a big merger announcement takes an industry group lower, but that's exactly what happened with T-Mobile (TMUS, -6.22%) and Sprint Corp (S, -13.69%) on Monday. Seasonally, the mobile telecommunications group ($DJUSWC) typically performs well in May (see Historical Tendencies below), but struggles throughout the summer. Monday's selling is setting up a key technical test as follows:
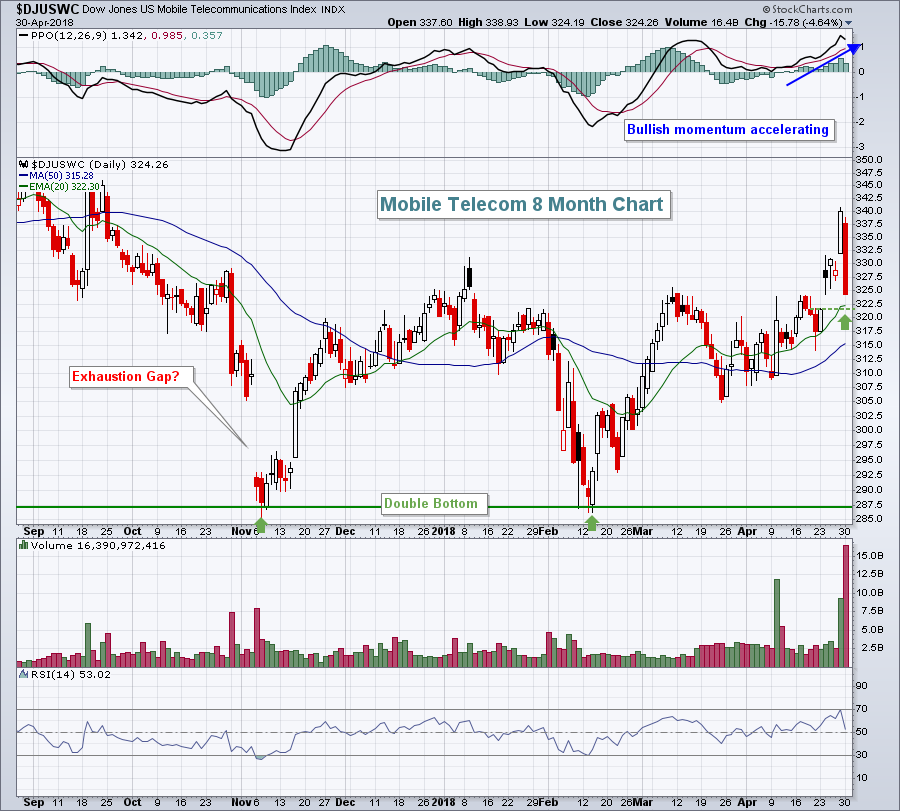 The green arrow mark both gap support and rising 20 day EMA support. Given the strength in the PPO currently, my expectation would be to see this support level hold and the DJUSWC turn back higher. That would align nicely with the May historical tendencies for the group as well.
Historical Tendencies
Over the past 19 years, the Dow Jones U.S. Mobile Telecommunications Index ($DJUSWC) has averaged gaining 2.9% during the month of May. That seasonal strength then runs into serious headwinds as June, July, August and September have produced average gains (losses) of (1.5%), 0.2%, (2.1%), and (2.4%), respectively, since 1999.
Key Earnings Reports
(actual vs. estimate):
ADM: .68 vs .47
AET: 3.19 vs 2.97
AMT: 1.73 vs 1.76
BP: .78 vs .67
CMI: 3.30 vs 2.91
EMR: .76 vs .71
ETN: 1.10 vs 1.06
FIS: 1.09 vs 1.04
HCA: 2.07 (estimate - still awaiting results)
JCI: .53 vs .52
MRK: 1.05 vs .99
PFE: .77 vs .74
(reports after close, estimate provided):
AAPL: 2.69
ALL: 2.48
APC: .43
FISV: .73
GILD: 1.66
MDLZ: .61
OKE: .62
SU: .45
Key Economic Reports
April PMI manufacturing index to be released at 9:45am EST: 56.5 (estimate)
April ISM manufacturing index to be released at 10:00am EST: 58.6 (estimate)
March construction spending to be released at 10:00am EST: +0.5% (estimate)
Happy trading!
Tom
