Market Recap for Friday, June 22, 2018
Bifurcated market action once again permeated Wall Street, but with much different results this time. Instead of the Dow Jones lagging badly and finishing in negative territory, this large cap index broke its eight session losing streak and gained 119 points (+0.49%) on Friday. The other major indices failed to keep up with the S&P 500 rising just 0.19%, while the more aggressive NASDAQ and Russell 2000 fell 0.26% and 0.20%, respectively. Energy (XLE, +2.00%) and materials (+1.46%) were the sector leaders and financials (XLF, -0.48%) and technology (XLK, -0.32%) lagged for a change. Technology had been a clear leader with internet stocks ($DJUSNS) pacing the recent strength. The DJUSNS held up well during Friday's weakness, dropping just 0.04% on the session.
On the S&P 500, Carmax (KMX) broke out to all-time highs after reporting much better than expected quarterly earnings results:
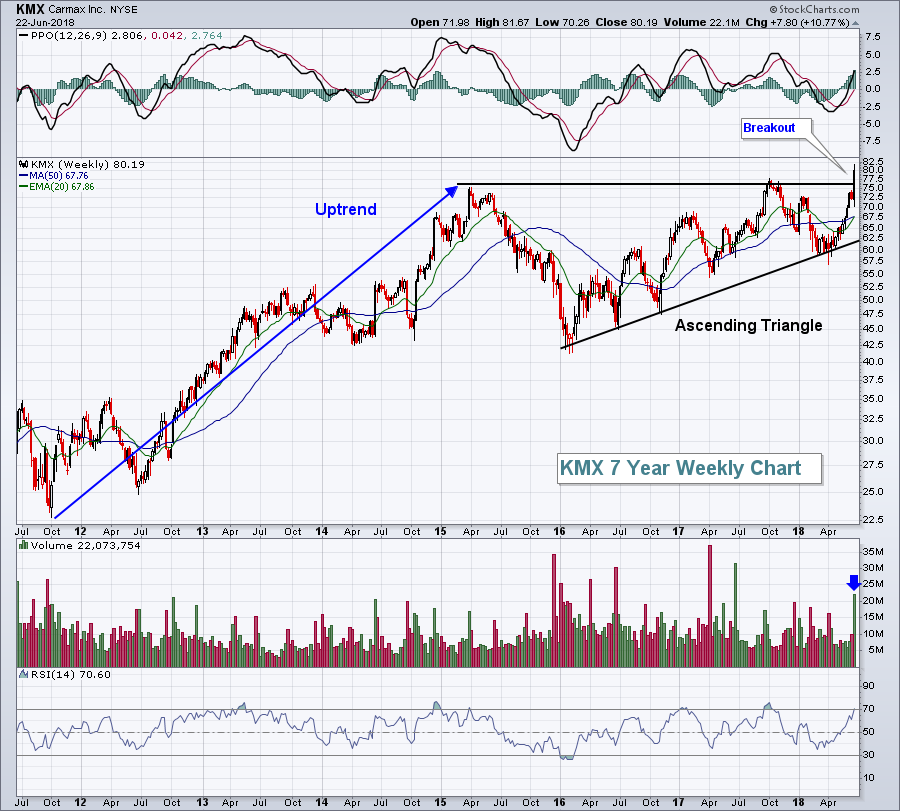 The blue arrow highlights the increased volume to confirm the breakout. This ascending triangle pattern breakout measures to the 105-110 area in time.
All was not good on the earnings front, however, as the worst performing S&P 500 company was Red Hat, Inc. (RHT), which fell more than 14% to lead the software group ($DJUSSW) lower:
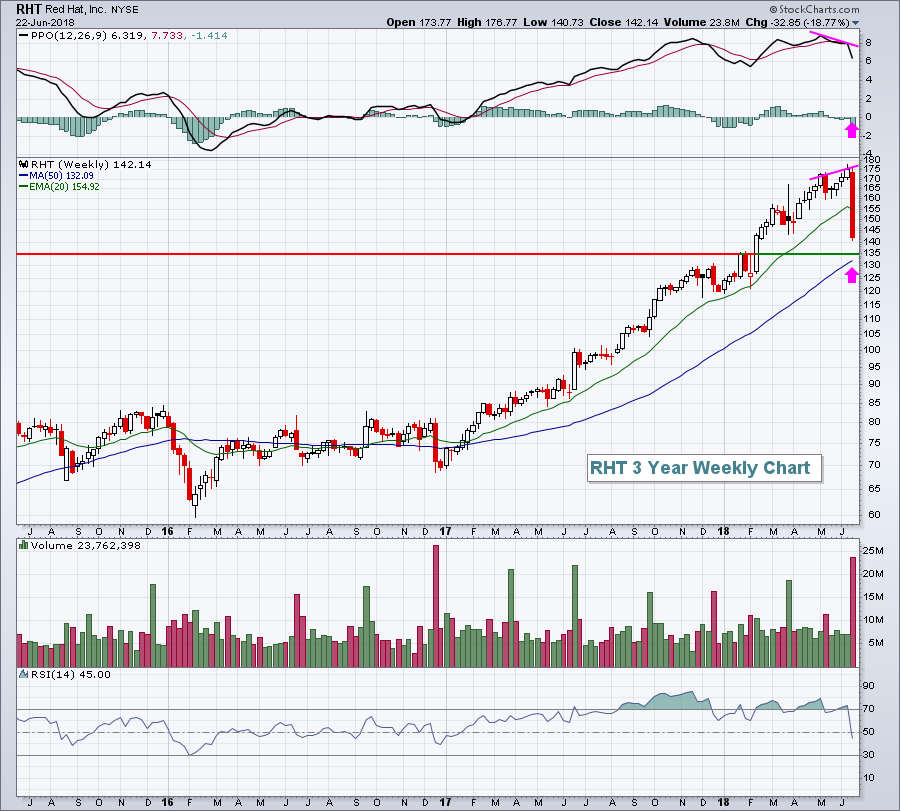 The most recent breakout was on average volume at best and was accompanied by a negative divergence. These divergences are indicative of slowing price momentum and the volume certainly supported this conclusion. RHT is a perfect illustration of why I won't hold any stock into its quarterly earnings report. I still like the software industry moving forward and RHT should begin to find buyers at price support near 135 and/or its rising 50 week SMA, currently at 132. Over the next few weeks, I'd expect the falling 20 week EMA to provide significant resistance during any oversold bounce attempt, while the 50 day SMA is likely to attract buyers. Consider that to be a short-term trading range.
Pre-Market Action
More trade talk is spooking futures as money once again rotates towards defense. The 10 year treasury yield ($TNX) has fallen back to 2.89%. Crude oil ($WTIC) is continuing the strength it saw last week with the WTIC up 0.70% to just above $69 per barrel this morning.
Meanwhile, Dow Jones futures are following the lead of global equity markets and tumbling 167 points just 45 minutes before the opening bell.
Current Outlook
Should the overall stock market continue to struggle based on trade fears, one industry group that could struggle is semiconductors ($DJUSSC). Many key leaders have exposure to China, including Intel (INTC) and Applied Materials (AMAT) and both have performed poorly this month as trade fears have escalated. Furthermore, there's a weekly negative divergence in play. If 20 week EMA support is lost, there's plenty of downside room to the 50 week SMA:
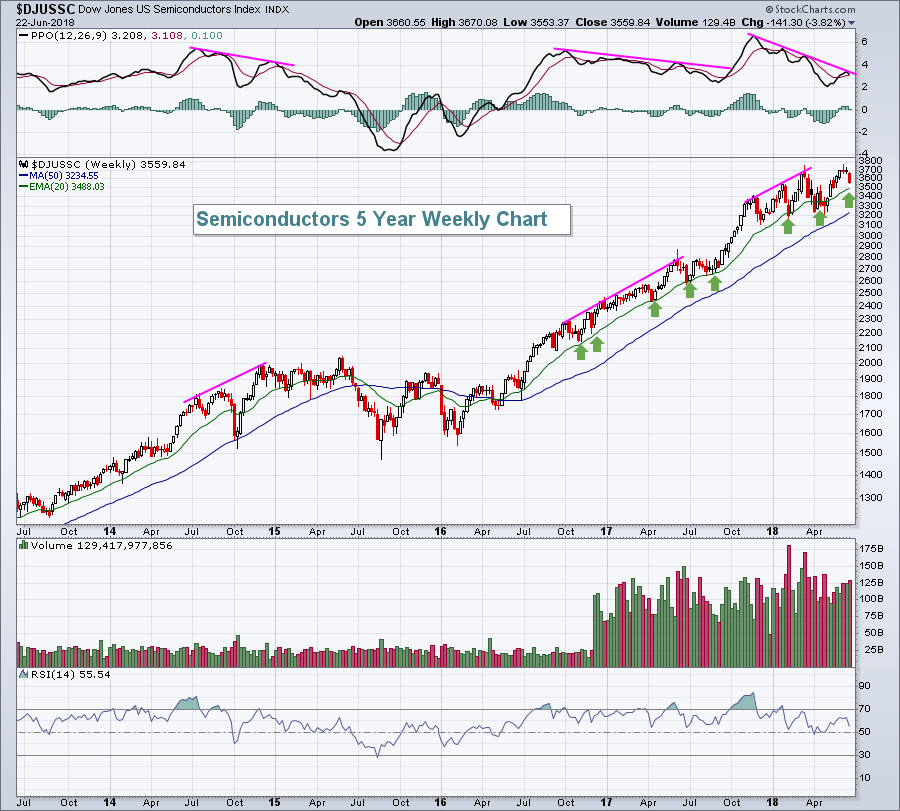 There have been two previous negative divergences on this 5 year weekly chart with two very different results. Technical analysis does not provide us guarantees, it simply helps us manage risk. In my view, there are times when hedging should be considered for long trades. The above negative divergence suggests that we at least consider hedging strategies. One such strategy would be to use a covered call options strategy to help protect against short-term downside action. Please be sure that you have the necessary understanding of options and how they work before utilizing this strategy, however.
Sector/Industry Watch
The Dow Jones U.S. Telecommunications Equipment Index ($DJUSCT) was in a very strong uptrend through the second week of March. Since that time, it's been consolidating in bullish fashion as equal highs and higher lows have resulted in an ascending triangle, a bullish continuation pattern. Check it out:
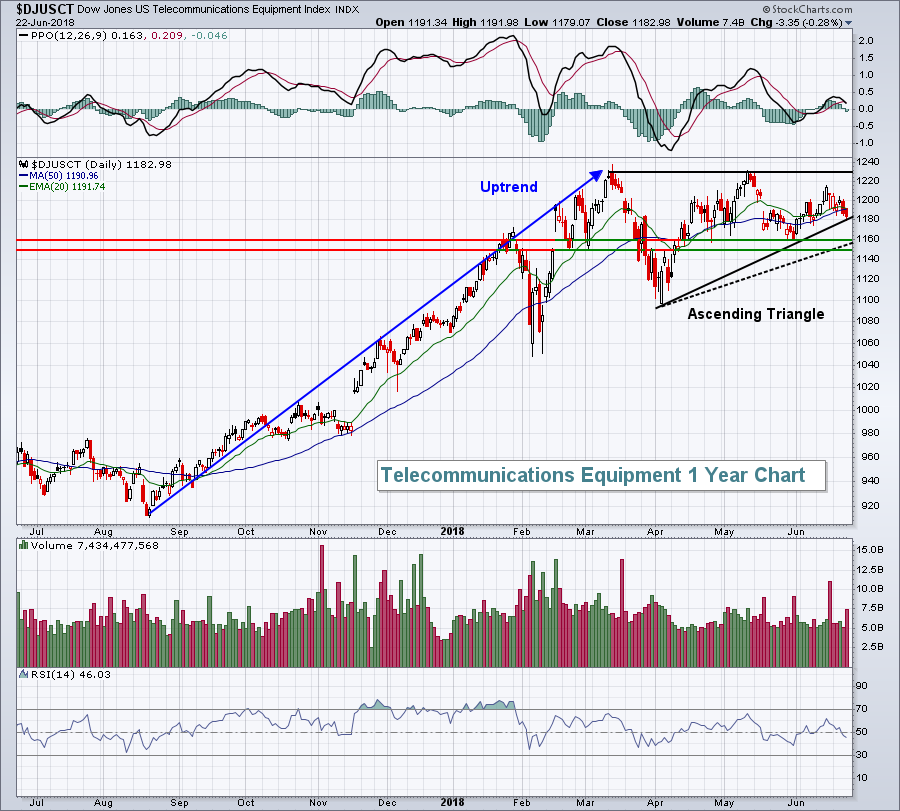 While we could draw an uptrend line connecting Friday's close, perhaps a better and more solid support area would be a slightly further near-term drop to the 1150-1160 area (black dotted uptrend line). We've seen price supported in this range previously and that would result in a more reliable pattern in my opinion.
One stock in this space that could benefit from second half strength in this index is QUALCOMM, Inc. (QCOM). QCOM has a history of performing extremely well during the second half of the year as discussed below in the Historical Tendencies section.
Monday Setups
Magna International (MGA) has weakened since topping a month or so ago and is quickly becoming a solid reward to risk trade candidate. I like two entries here as follows:
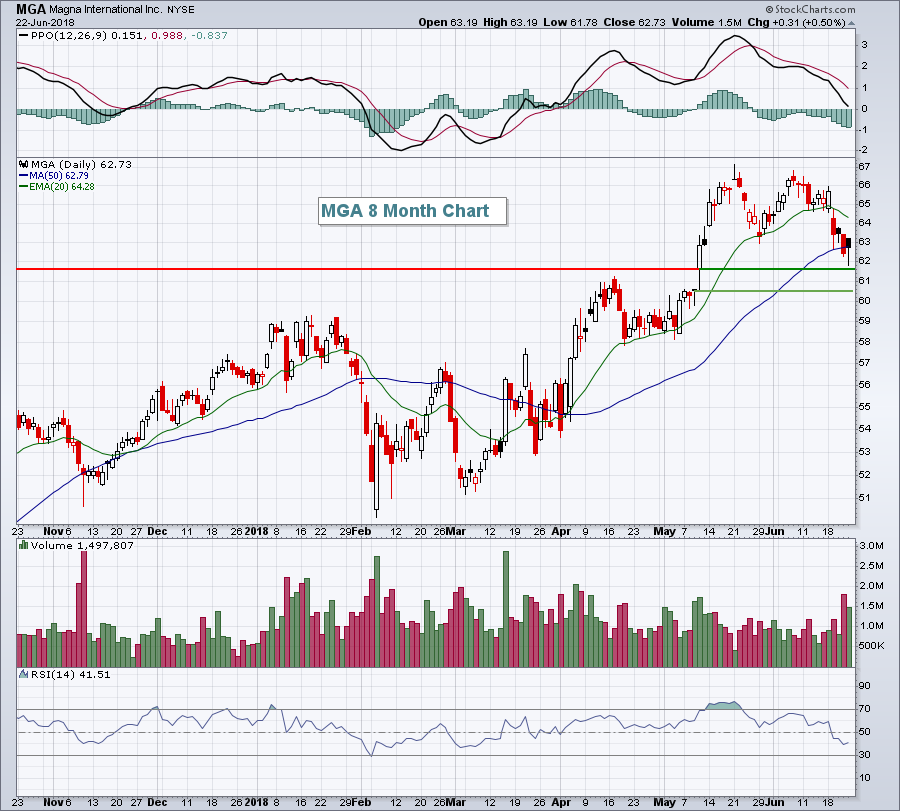 Entry at the current price and again close to the top of gap support at 61.75 would provide an average entry of roughly 62.25. Consider a closing stop beneath 60.50 and an initial target of 67.00. That provides a solid 2.5 reward to risk ratio. Waiting and entering a full position at 61.75 would improve that reward to risk ratio to better than 4:1.
Historical Tendencies
Qualcomm (QCOM) has a history of performing much better during the second half of the calendar year. Here's the breakdown if I add the average monthly returns of each calendar month over the past two decades:
January through June: +4.5%
July through December: +22.7%
Given the bullish pattern of the DJUSCT, as discussed above, and the healthy 4.4% annual dividend yield of QCOM, you might consider this tech stock as part of your portfolio as we enter the second half of the year.
Key Earnings Reports
(actual vs. estimate):
CCL: .60 (estimate - awaiting results)
Key Economic Reports
May new home sales to be released at 10:00am EST: 665,000 (estimate)
Happy trading!
Tom
