Market Recap for Monday, July 23, 2018
Financials (XLF, +1.38%), especially banks ($DJUSBK, +1.86%), led Wall Street on Monday as the rising 10 year treasury yield ($TNX) provides hope for increasing profits in the quarters ahead for this influential industry group. There's a very strong and tight positive correlation between these two, highlighted on the following chart:
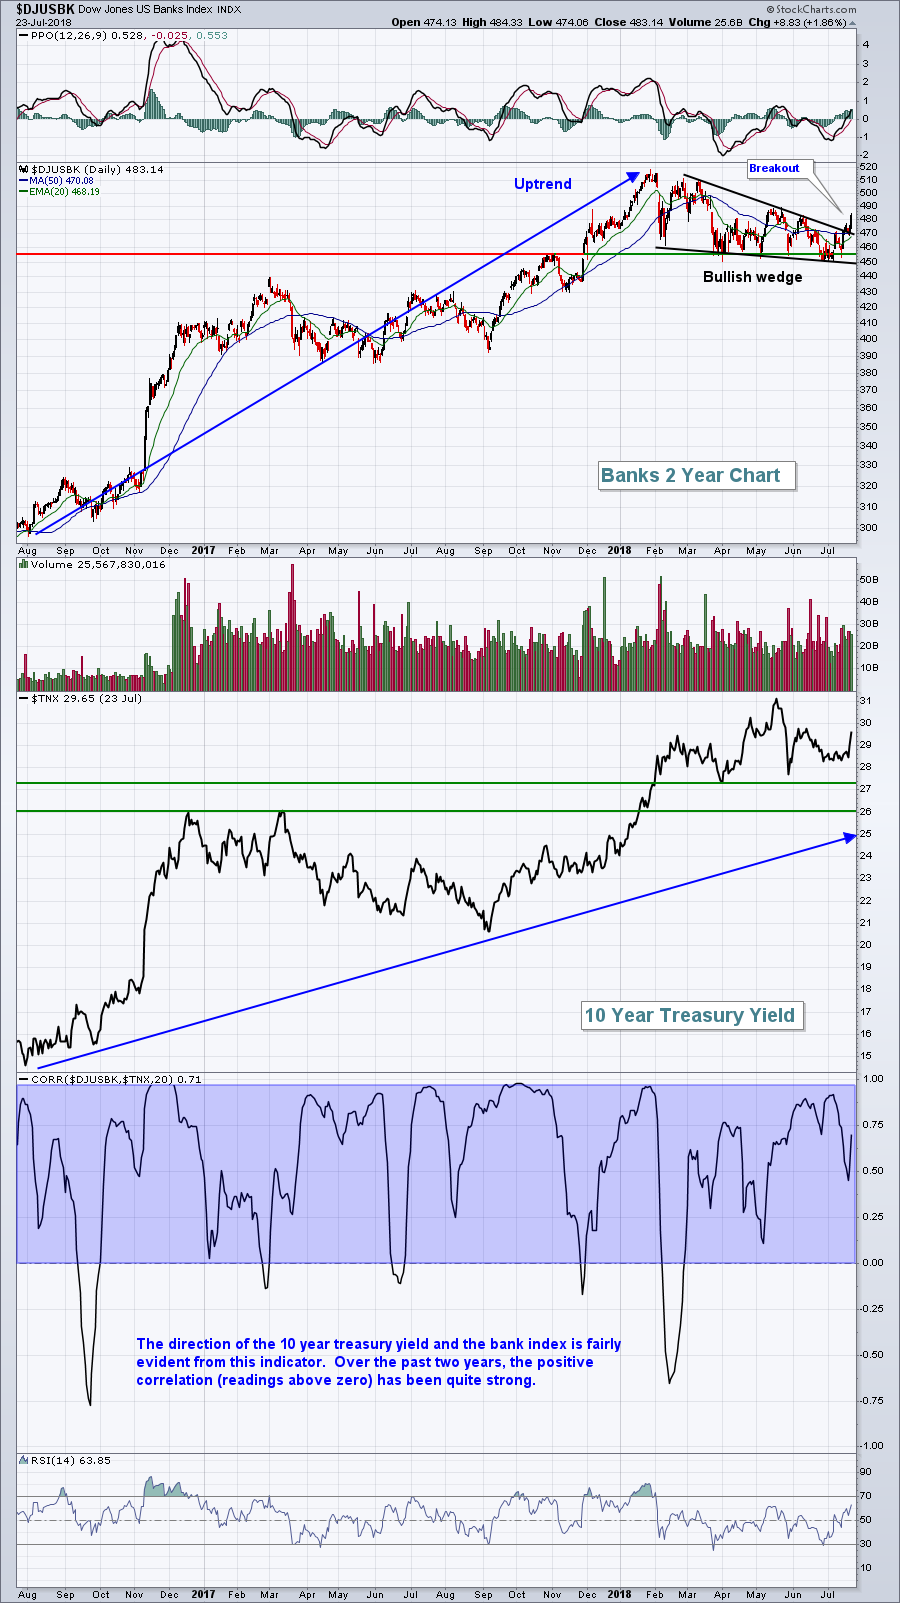 The recent strength in the DJUSBK has resulted in a solid breakout of a bullish wedge pattern. This breakout has accompanied a surge higher in the TNX. This once again underscores the positive correlation that's typically seen between the DJUSBK and TNX.
Technology (XLK, +0.51%) also performed well on the day, with software ($DJUSSW, +0.95%) and internet stocks ($DJUSNS, +0.92%) easily the two leading industry groups.
Defensive-oriented stocks lagged badly on the session as utilities (XLU, -0.71%) and consumer staples (XLP, -0.62%) were the worst performers. Staples were held back by profit taking in soft drinks ($DJUSSD), which had been the best performing group within staples over the past month, gaining more than 5% during that span.
Pre-Market Action
Strong earnings and the recent surge in the 10 year treasury yield (and corresponding selling of treasuries) are leading the U.S. market higher this morning. Currently, and with roughly 30 minutes left to the opening bell, Dow Jones futures are higher by 116 points.
Asian markets were strong overnight and a 1.50% surge in the German DAX ($DAX) is leading European markets higher as well.
Current Outlook
One of the ratios I regularly review to assess the sustainability of a move higher in our major indices is the $TRAN:$UTIL. This tells me how transportation stocks are performing vs. utilities stocks. In a strengthening economy (or a perceived strengthening economy), money should rotate towards transports and away from the defensive utilities. After a very weak June, this ratio has turned back up and closed yesterday at its highest July level:
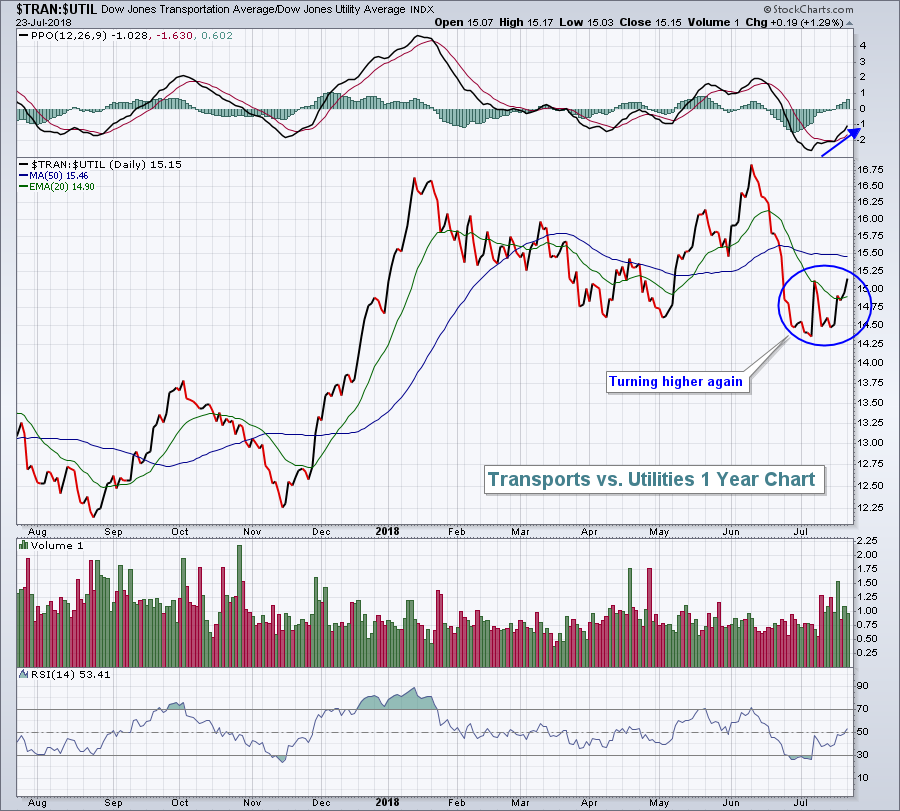 Many times you'll see this ratio move in the same direction as the 10 yer tresury yield ($TNX) and we've seen the TNX move significantly higher the past few days. Look for further strength in this ratio so long as the uptrend in treasury yields continue.
Sector/Industry Watch
The Dow Jones U.S. Toys Index ($DJUSTY) has been the best performing industry group over the past three months, rising 22.23%. Technical indications suggest that could change in the near-term as illustrated below:
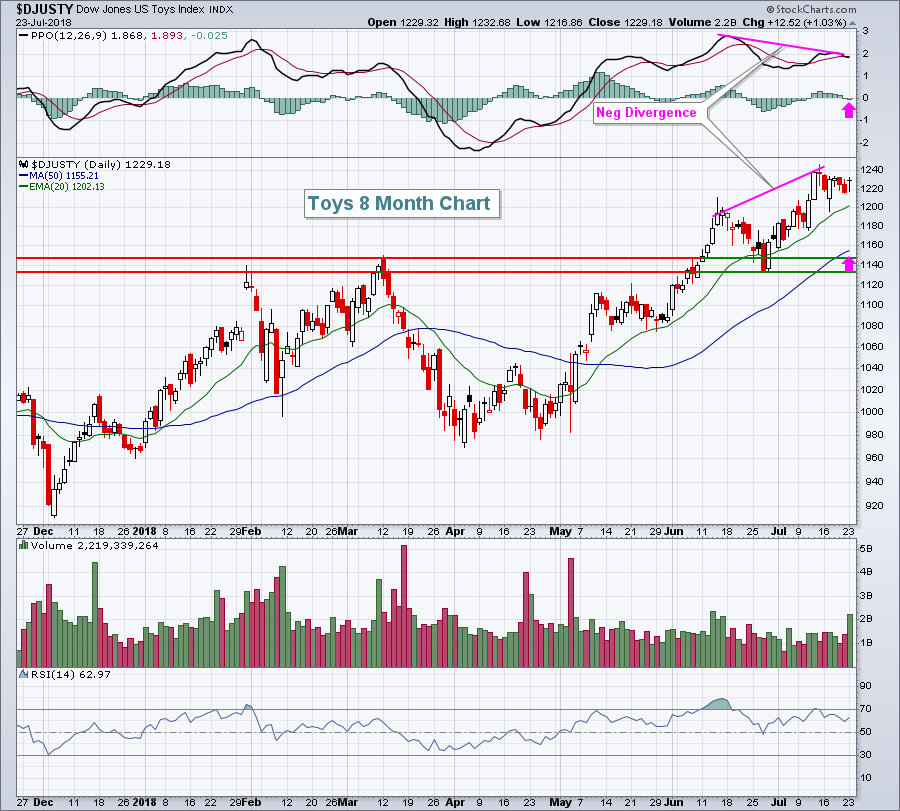 I look for 50 period SMA and PPO centerline tests (pink arrows) after negative divergences print. A close below 1200 would be the first signal that such tests are underway. While the DJUSTY has been extremely bullish, I do believe the risks outweigh the benefits of being long right now. I'd look elsewhere for trades.
Historical Tendencies
A bearish historical week ends at the close today and a mildly bullish period begins. Since 1950 on the S&P 500, the July 25th through August 2nd period has produced annualized returns of +18.45%, which is approximately double the return of the S&P 500 throughout the year. However, the NASDAQ and Russell 2000 have not produced bullish results during this period so history is a bit bifurcated as we close out July.
Key Earnings Reports
(actual vs. estimate):
BIIB: 5.80 vs 5.22
CNC: 1.80 vs 1.76
IQV: 1.29 vs 1.24
KMB: 1.59 vs 1.57
LLY: 1.50 vs 1.31
MMM: 2.59 vs 2.59
SHW: 5.73 vs 5.59
UTX: 1.97 vs 1.85
VZ: 1.20 vs 1.14
(reports after close, estimate provided):
CB: 2.63
CNI: 1.05
EQR: .80
SYK: 1.73
T: .86
TXN: 1.33
Key Economic Reports
May FHFA house price index to be released at 9:00am EST: +0.4% (estimate)
July PMI composite flash to be released at 9:45am EST: 56.3 (estimate)
Happy trading!
Tom
