Note
I'll be traveling and on vacation this week, so my blog articles will focus on very brief topics regarding current market themes or my own trading strategies. I'll return to my "normal" blog postings regarding market action, outlook, historical tendencies, etc. when I return on Monday, August 20th.
Wednesday, August 15th
I trade companies where revenue and EPS estimates have been surpassed in their most recent quarterly reports, but I don't just buy at any price. I want to maximize my reward to risk upon entry so unless I can catch a breakout in its very early stages, I wait for a pullback to key price, gap or moving average support. Typically this occurs after a surge in price, which results in accelerating bullish price momentum. That's where the PPO comes in handy. A rising PPO is the definition of accelerating bullish price momentum in my view as the shorter-term 12 day EMA pulls away from the longer-term 26 day EMA. When I see a rising PPO above the centerline and then subsequently get a pullback to test the rising 20 day EMA, it's generally a solid time to enter from a short-term perspective, unless there's a negative divergence in place. Here's a good example to highlight my trading strategy:
Let me describe my thinking at each of the points highlighted above:
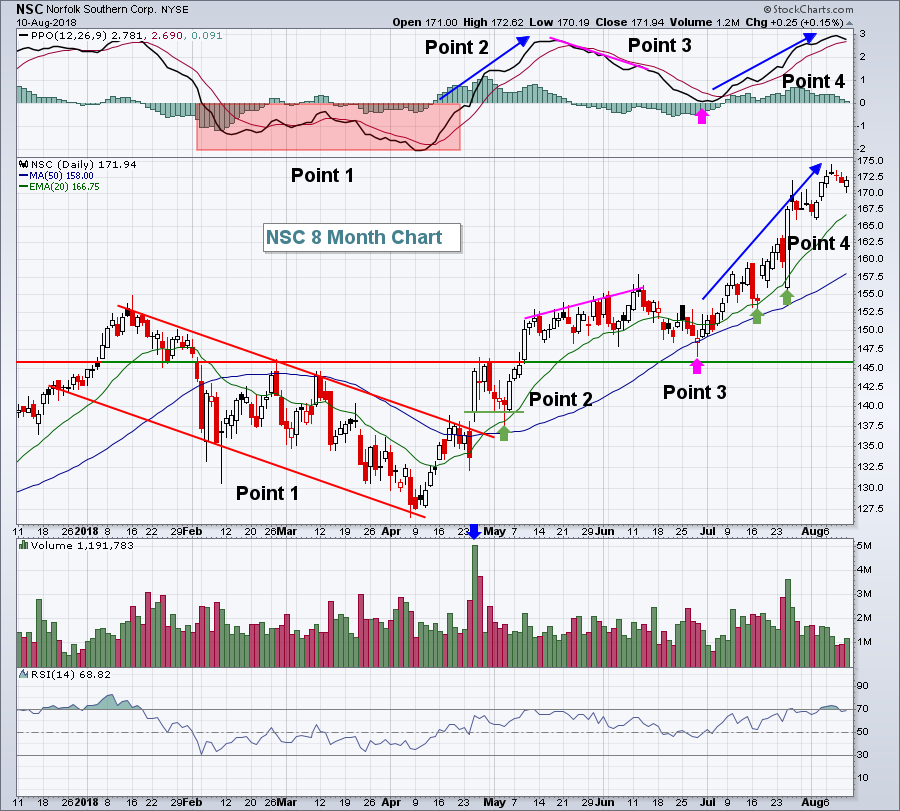
Point 1 - Norfolk Southern (NSC) is in a down channel with a PPO in negative territory (red shaded area), so I have no interest whatsoever from a trading perspective. Keep in mind we're in a bull market, so I don't short. I'm looking exclusively for solid momentum plays to the upside. At this point, NSC doesn't qualify.
Point 2 - Ok, now we've had a change of character on the chart. The downtrend has been broken and heavy volume has accompanied a solid earnings-related gap higher. Also, note the PPO quickly surged into positive territory - a signal that this now becomes a long candidate. As the PPO accelerates, I now look for a test of gap support or the rising 20 day EMA. That occurs a few days later (green arrow). Entry at that level could include a stop at the bottom of gap support, which was never violated. NSC then surged again and would have been a very profitable trade.
Point 3 - In the second week of June, a doji (reversing candle) prints off an uptrend and a negative divergence in is play. A negative divergence is where prices are moving higher, but the PPO is moving lower. It's a sign of slowing price momentum. When I see a negative divergence, I begin to think "50 day SMA test" and a "reset" of the PPO at centerline support (pink arrows). Now I await the next move on NSC before trading it. Will it break down? Or will it resume its prior trend higher?
Point 4 - The prior trend higher resumes and the PPO bounces right off of centerline support. Note the ensuing pullbacks are quite shallow, reversing at 20 day EMA support (green arrows). Entries at that moving average once again become great reward to risk entry levels as bullish price momentum is underway.
Happy trading!
Tom
