Market Recap for Thursday, August 23, 2018
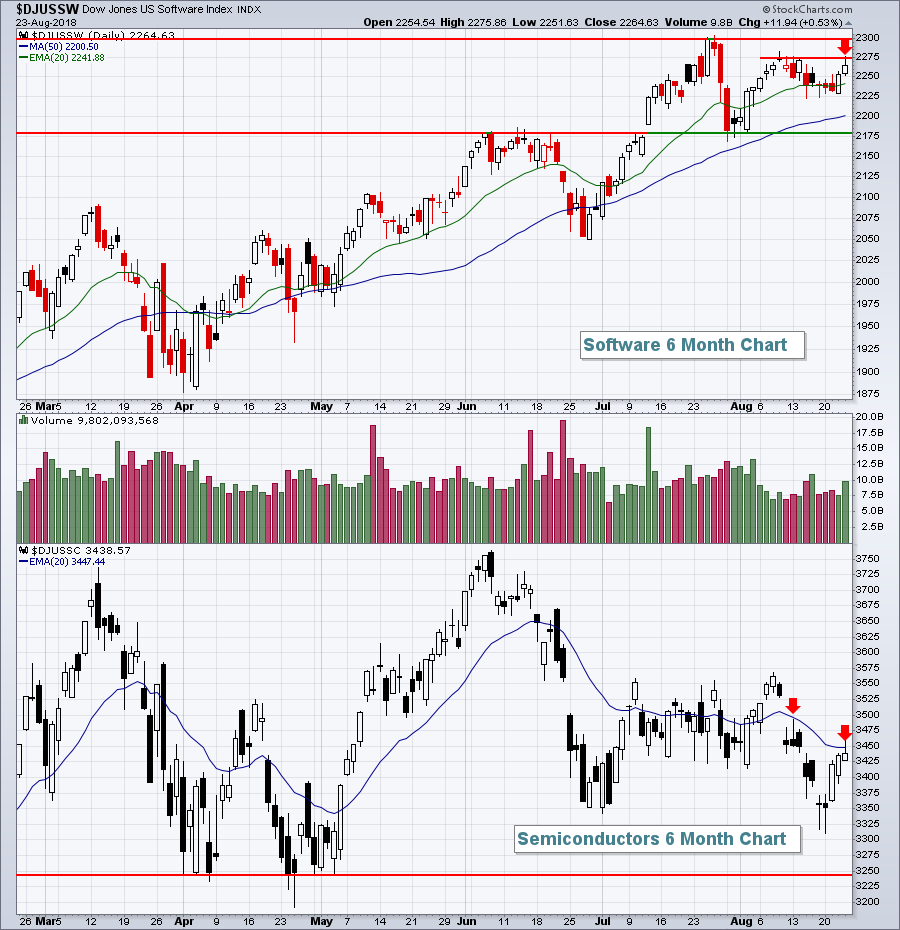
Technology (XLK, +0.22%) was the only sector to finish in positive territory on Thursday. The remaining sectors were lower, led by materials (XLB, -0.68%), energy (XLE, -0.47%) and financials (XLF, -0.46%). The result was losses on all of our major indices. The NASDAQ was in positive territory throughout much of the day because of technology's relative strength, but the final hour of trading took care of that. Both software ($DJUSSW) and semiconductors ($DJUSSC) failed at key resistance levels:
 These are not the only failures to worry about. Transports ($TRAN) couldn't be printing a more bearish candlestick on its weekly chart:
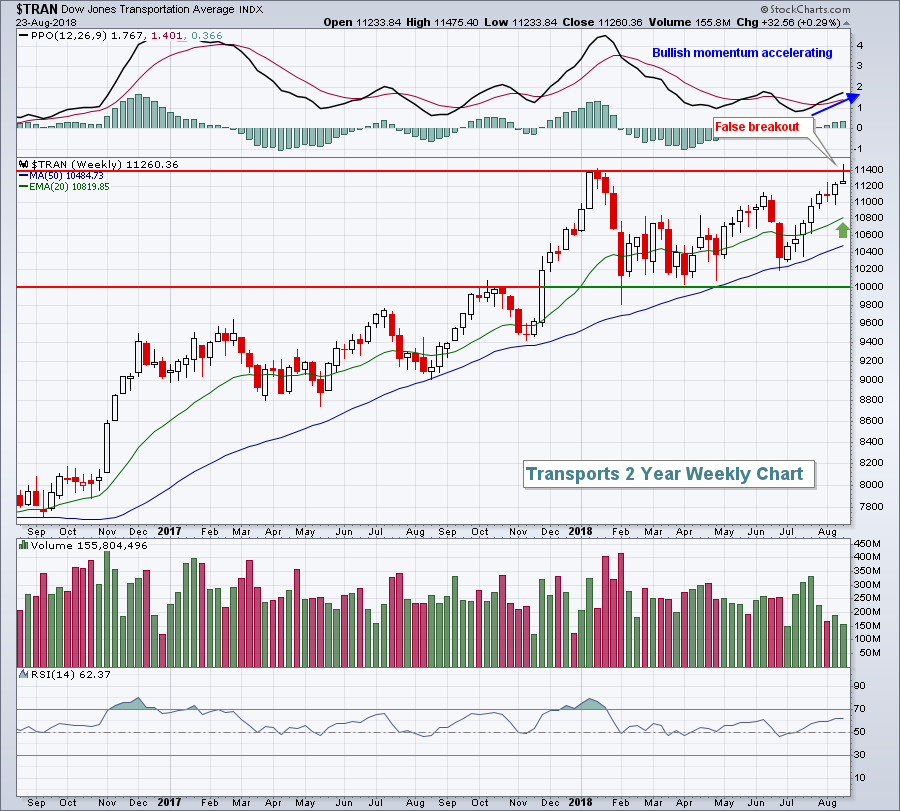
Given the strong momentum in the TRAN, I expect only a temporary pullback to perhaps test the rising 20 week EMA (green arrow), but that could be enough to derail the S&P 500 as it approaches its worst calendar month (September) of the year.
Speaking of "derailing", the railroads also appear to pose a problem for transports in the near-term. Check out the negative divergence here:
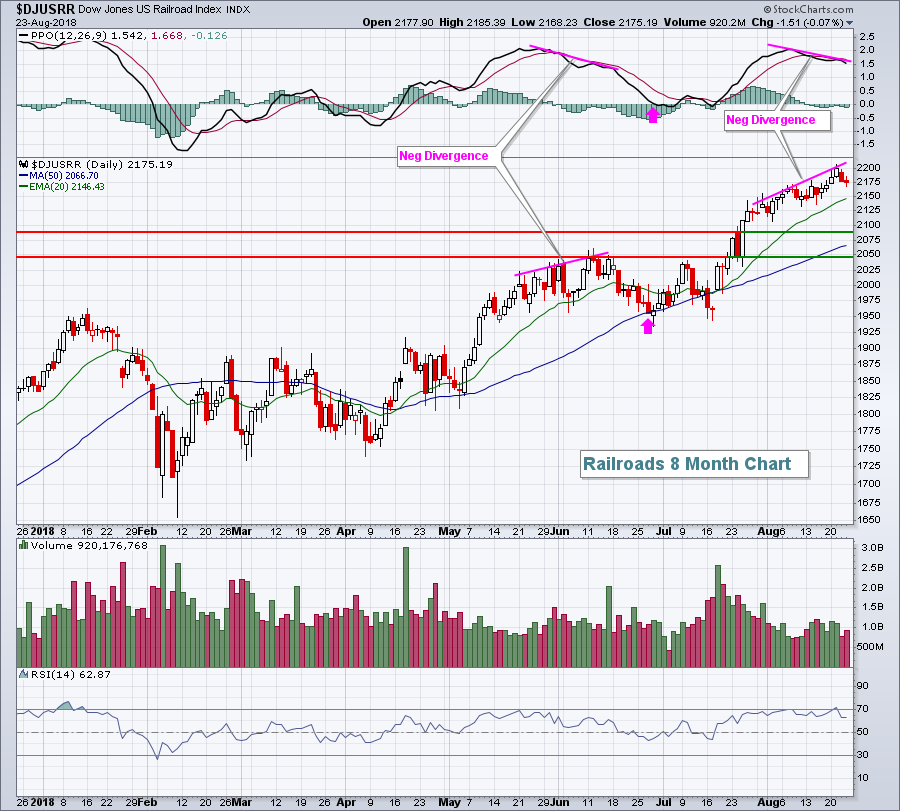 While negative divergences don't provide us any guarantees, they do suggest being cautious and that's exactly what I am right now. Cautious. I'm not bearish, there's a big difference. But you can look above and see what happened to railroads the last time a negative divergence appeared. It didn't kill the long-term rally, just temporarily suspended it. That's what I'm expecting now.
Pre-Market Action
The 10 year treasury yield ($TNX) is up 3 basis points to 2.85% and crude oil ($WTIC) is up more than 1% to $68.58 per barrel this morning. Gold ($GOLD) is bouncing 0.5% to $1200 per ounce as the dollar sags against other major foreign currencies. Asia was mixed overnight and stocks in Europe trade fractionally higher.
Dow Jones futures currently are higher by 52 points as we near the opening bell.
Current Outlook
I sense that the S&P 500 is in trouble in the near-term. If it can break above 2873 on a closing basis, then perhaps the recent uptrend can continue. But I have my doubts. There are a number of reasons for my cautiousness as we approach the bearish month of September. I highlighted a chart of the transports ($TRAN) above showing their failed breakout on a weekly chart. Home construction ($DJUSHB) failed once again at a break above its 20 week EMA with an ugly tail above that moving average and a current price well beneath it. Then we have semiconductors ($DJUSSC), software ($DJUSSW) and internet ($DJUSNS) - the three key pillars of technology (XLK) - all with their own technical issues. The DJUSSC failed yesterday at its 20 day EMA. Software tested its August high and backed off of it. And internet ($DJUSNS) has an unsettling head & shoulders pattern in play and I'm not a fan of Facebook (FB). I believe there's a better than average chance the neckline fails to hold as support:
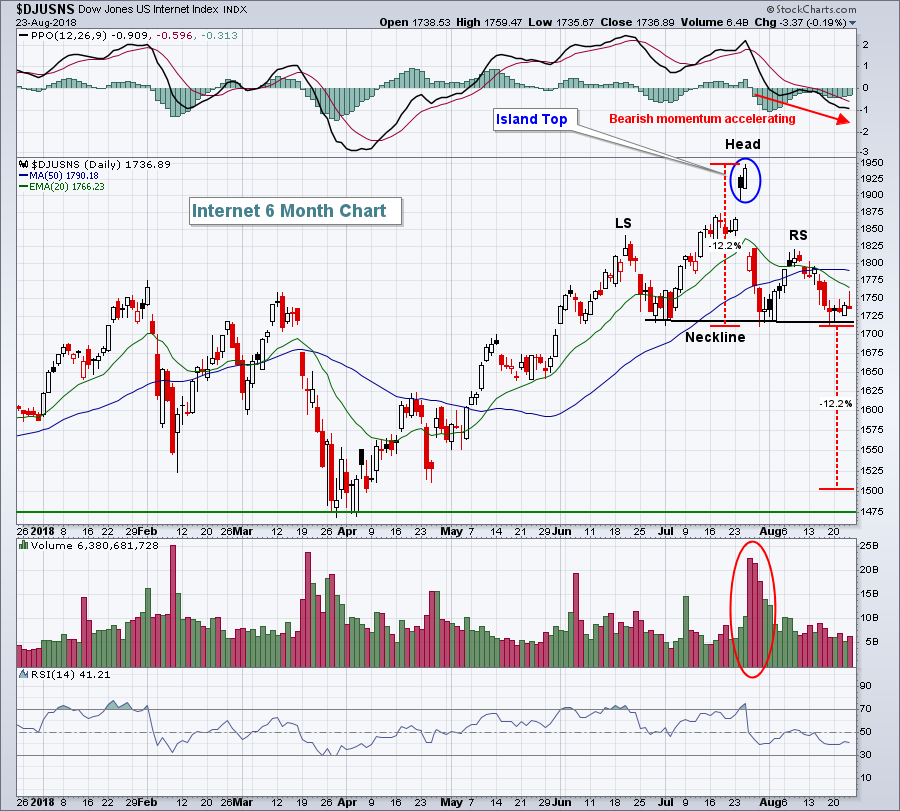 The downsloping neckline and shoulders adds a bit more bearishness to the pattern, in my opinion and based on my experience. And the bomb that FB dropped on Wall Street won't soon be forgotten so I'm staying away from most of this space (GOOGL still looks solid to me).
Sector/Industry Watch
Below in Historical Tendencies, I discuss the upcoming bullish tendencies for footwear stocks, especially Nike (NKE). Perhaps the better news is that this historical bullishness aligns quite nicely with the current technical outlook:
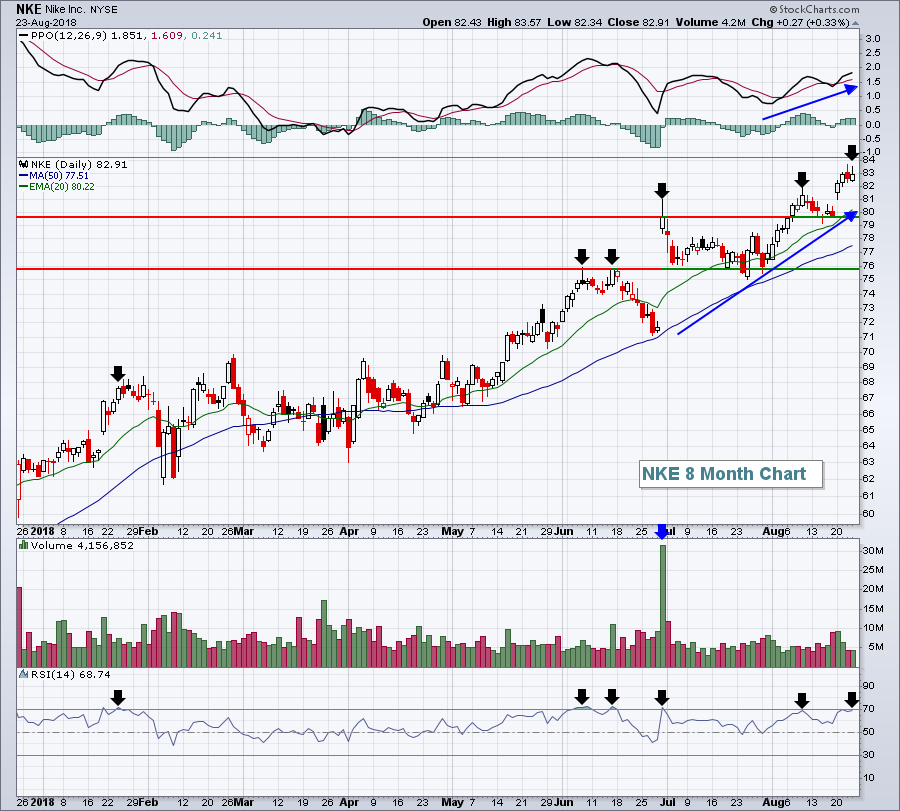 A pullback to close out August would be nice as NKE is a bit overbought, as measured by RSI. The black arrows above show that when NKE hits 70 RSI, it has a tendency to pull back and relieve those overbought conditions. The uptrend remains intact, however, so a rising 20 day EMA test would represent a solid reward to risk entry.
Historical Tendencies
Over the past two decades, the Dow Jones U.S. Footwear Index ($DJUSFT) has averaged gaining 9.1% from September through November. Nike (NKE) is the big reason. Over the same 20 year period, NKE has averaged gaining 10.7% over these three calendar months. September, which is the most bearish calendar month for the S&P 500, is NKE's best calendar month. NKE has risen 74% of Septembers over the past 20 years and has averaged gaining 6%.
Key Earnings Reports
(actual vs. estimate):
UBNT: 1.01 vs .98
FL: .75 vs .70
Key Economic Reports
July durable goods released at 8:30am EST: -1.7% (actual) vs. -0.8% (estimate)
July durable goods ex-transports released at 8:30am EST: +0.2% (actual) vs. +0.5% (estimate)
Happy trading!
Tom
