Market Recap for Monday, September 17, 2018
Selling in technology (XLK, -1.25%) and consumer discretionary (XLY, -1.24%) resulted in losses across our major indices on Monday. The NASDAQ, understandably, felt the brunt of the selling as this tech-laden index dropped 1.43%. The Russell 2000 ($RUT) suffered the most technical damage, shedding more than 1% to close beneath its recent breakout level:
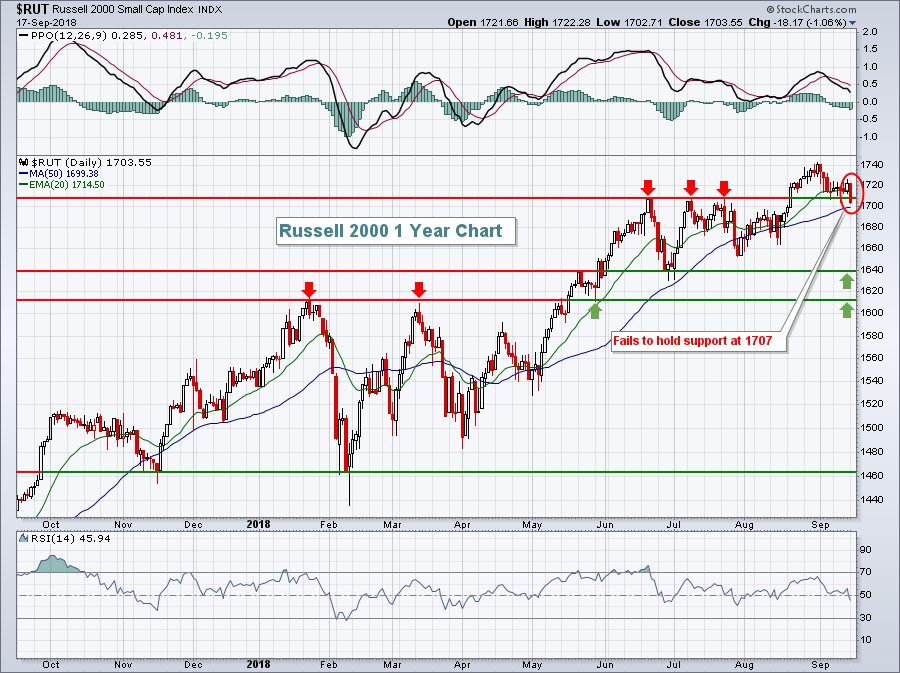 Earlier this year (January and March) when we had multiple tops form resistance, the break above resulted in solid support during the profit taking period that ensued. In June and July, a triple top formed. But that resistance-turned-support failed to hold yesterday and could result in further selling. While it's difficult to say how much further we might go, let's recognize that the second half of September has a bearish history and starting it off with a short-term break of price support is anything but ideal. The primary thing I'll look for today is a response by the bulls. Can we climb back above that 1707 level or does it become a target for more selling to kick in?
Retailers (XRT, -1.02%) were notably weak as the two worst performing industry groups within consumer discretionary were broadline retailers ($DJUSRB, -2.56%) and specialty retailers ($DJUSRS, -2.05%). For the former, it was the first serious close beneath its rising 20 day EMA in months:
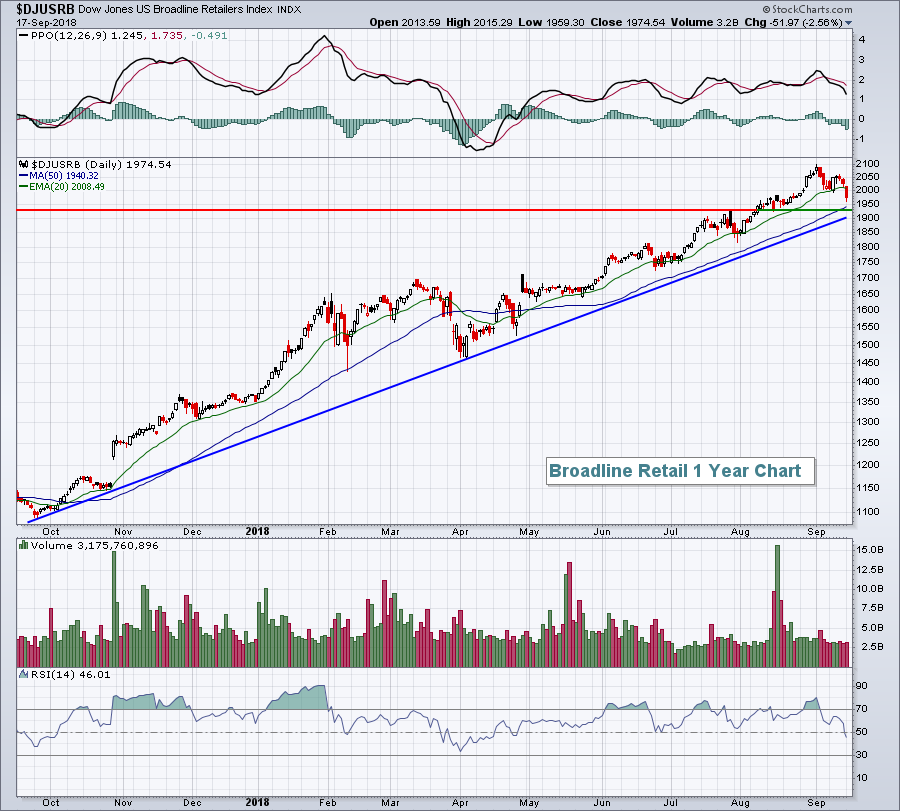 One piece of good news is that volume yesterday was fairly light. A reversal back above the rising 20 day EMA is what we'd like to see. Failure to do so would likely result in further selling down to the 1900-1925 area.
Pre-Market Action
The 10 year treasury yield ($TNX) is up again this morning and currently at 3.02%. Holding this area would suggest a short-term breakout from the recent 2.81%-3.01% range and a likely target of 3.11% to test the earlier 2018 high. Crude oil prices ($WTIC) are rising this morning, up 1.34% to just under $70 per barrel at last check.
Asian markets rallied nicely overnight and European indices are mostly higher, albeit fractionally. U.S. indices are following suit to the upside with Dow Jones futures up 73 points a little more than 30 minutes before the opening bell.
Current Outlook
In the Market Recap section above, I discussed the Russell 2000's breakdown on the daily chart, so let's take a look here at the 60 minute intraday chart for the past few months:
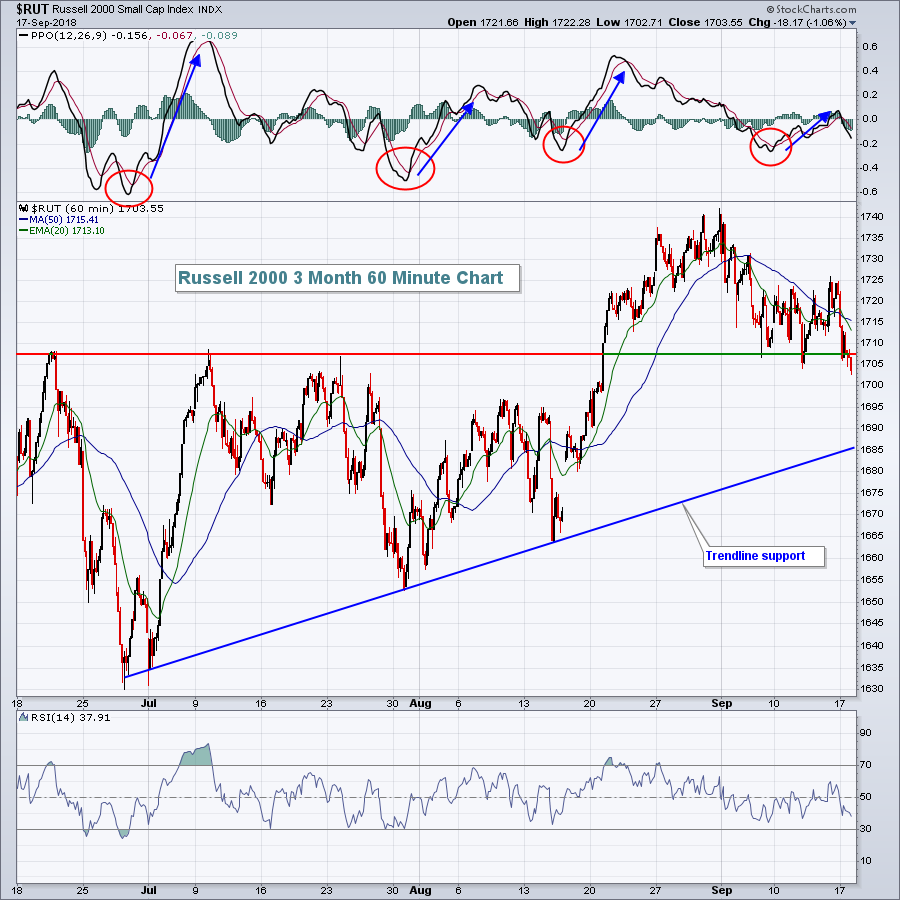 The red circles highlight the fact that the past few times we've seen short-term weakness and breaks beneath the PPO centerline, the Russell 2000 quickly recovered with the PPO each time moving above centerline resistance and staying there for at least 1-2 weeks. This time, however, the PPO moved through centerline resistance only briefing and has resumed its move lower. This suggests more short-term downside price momentum. Connecting the past three price lows reveals a trendline that currently intersects 1685, or thereabouts. It would seem as though the RUT has at least another 1% downside to test that rising trendline. If that fails, then look to the daily RUT chart provided in the Market Recap section for lower price support levels.
Sector/Industry Watch
Technology (XLK) is obviously a key component of the S&P 500 and traders look to this sector for leadership. Internet ($DJUSNS) issues have been well-documented here and they persist. Semiconductors ($DJUSSC) have multiple tests of support near the 3350 level. A confirmed close beneath this level could lead to more significant short-term selling. Software ($DJUSSW) and computer hardware ($DJUSCR) have both been very strong, but overbought and extended. In short, technology is on the verge of a bigger selloff. But what's the key level? Well, we could argue this one for quite some time. Everyone has a different view of what's important, depending your own investing style and strategy. But here's mine:
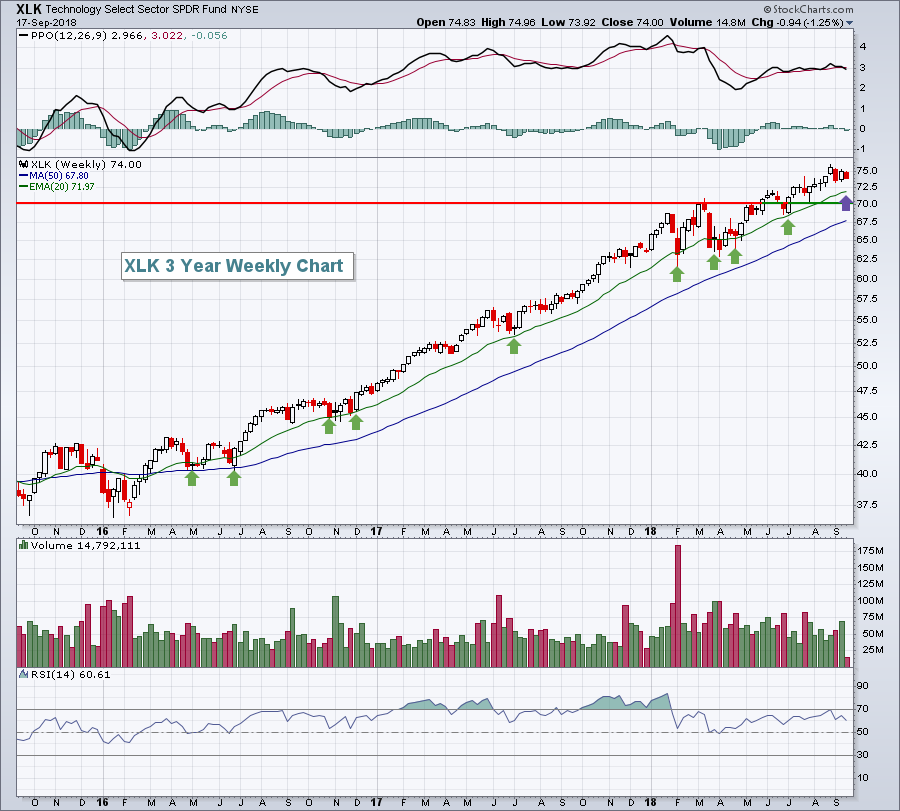 Over the last few years, the rising 20 week EMA (green arrows) has provided excellent support during short-term profit selling episodes. We've seen only a few breaks of this support and each time prices quickly resumed their upward trek. The purple arrow marks the current 20 week EMA at 71.97 so that's the first key level to watch. When Facebook (FB) delivered its debacle of an earnings report in late July, the XLK sold off down to 70.50 and a key weekly top in March was in that 70.00-70.50 neighborhood. That would be another critical area to hold, in my opinion. So with the XLK currently at 74 as we head into one of the worst seasonal periods of the year, just beware the possibility of additional selling that would likely scare the masses and create a little short-term panic. That would likely represent a very solid entry into what should be another strong quarterly earnings season that'll begin in mid-October.
Historical Tendencies
As I mentioned yesterday, the second half of September (-23.13%) is the worst part of the month historically for the S&P 500. Most of this weakness is concentrated during the September 20th through September 26th period, where the S&P 500 has posted annualized returns of -39.41%.
Key Earnings Reports
(actual vs. estimate):
AZO: 18.54 vs 17.88
GIS: .71 vs .64
Key Economic Reports
September housing market index to be released at 10:00am EST: 67 (estimate)
Happy trading!
Tom
