Market Recap for Tuesday, October 2, 2018
The Dow Jones rallied for a fourth consecutive day to close in all-time record high territory, eclipsing the previous high set on September 21st. Unfortunately, the rest of the market didn't get the memo as small cap stocks, in particular, were sold off rather rudely. While the Dow Jones was gaining more than 100 points, the Russell 2000 lost more than 1% for a second consecutive day to open up the fourth quarter. The interesting part is that this isn't unusual historically for the Russell 2000 (more on that below in Historical Tendencies).
After topping at 3.11%, the 10 year treasury yield ($TNX) is consolidating between 3.00% and 3.11%. While that's not a bad thing, short-term failure to breakout has slowed the amount of money rotating from defensive treasuries to aggressive equities. Therefore, part of the strength in the Dow Jones and S&P 500 of late isn't coming necessarily from new money. Rather, much of it is likely coming at the expense of the NASDAQ and Russell 2000 companies. A breakout in the TNX would resolve that issue and likely result in all of our equity indices showing strength.
Utilities (XLU, +1.35%) and consumer staples (XLP, +0.58%) led a defensive-oriented rally on Tuesday. Conventional electricity ($DJUSVE) continues to bounce off recent price support to help lead utilities higher:
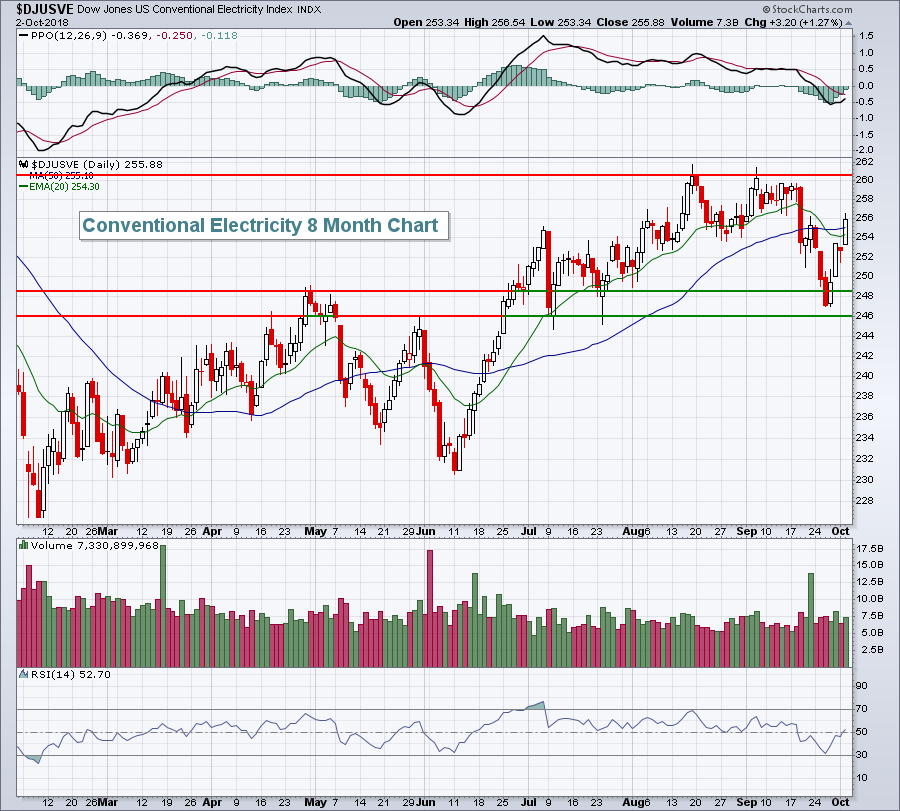 The trading range here is roughly 246-261.
On the flip side, consumer discretionary (XLY, -1.35%) as nearly every industry group within this sector declined. The completely beaten-down home construction ($DJUSHB, +0.18%) and auto parts ($DJUSAT, +0.09%) groups eked out fractional gains. Otherwise, there were mostly lower prices. Apparel retailers ($DJUSRA, -2.50%) led the assault and are discussed further in the Sector/Industry Watch section below.
Pre-Market Action
We're getting closer and closer to Q4 earnings season. A few companies are reporting now, but that will pick up over the next 2-3 weeks.
Lennar Corp (LEN) easily surpassed EPS estimates, becoming the 3rd major homebuilding company to do so in recent weeks (TOL and KBH were the others). It hasn't mattered as the stock market always looks forward and there's been a collective shrug each time one of these companies reports solid results. We'll see if today is any different.
Dow Jones futures are up 107 points at last check, with just under 30 minutes left to the opening bell. The U.S. Dollar (USD) and 10 year treasury yield ($TNX) are both higher, the latter by 3 basis points to 3.09%. It'll be interesting to see if both of those developments help to steady a very volatile and weak small cap group.
Global markets were/are mostly mixed overnight and this morning.
Current Outlook
The small cap Russell 2000 is wildly underperforming the benchmark S&P 500. It was justified for several weeks as the U.S. Dollar Index was retreating, but the USD is now trending higher again and I suspect we'll see small caps begin to outperform again soon, but when? There's been a disconnect between 10 year treasury yield spread between the U.S. and Germany and the direction of the USD, but the recent turn in the dollar to the upside is beginning to correct the issue there:
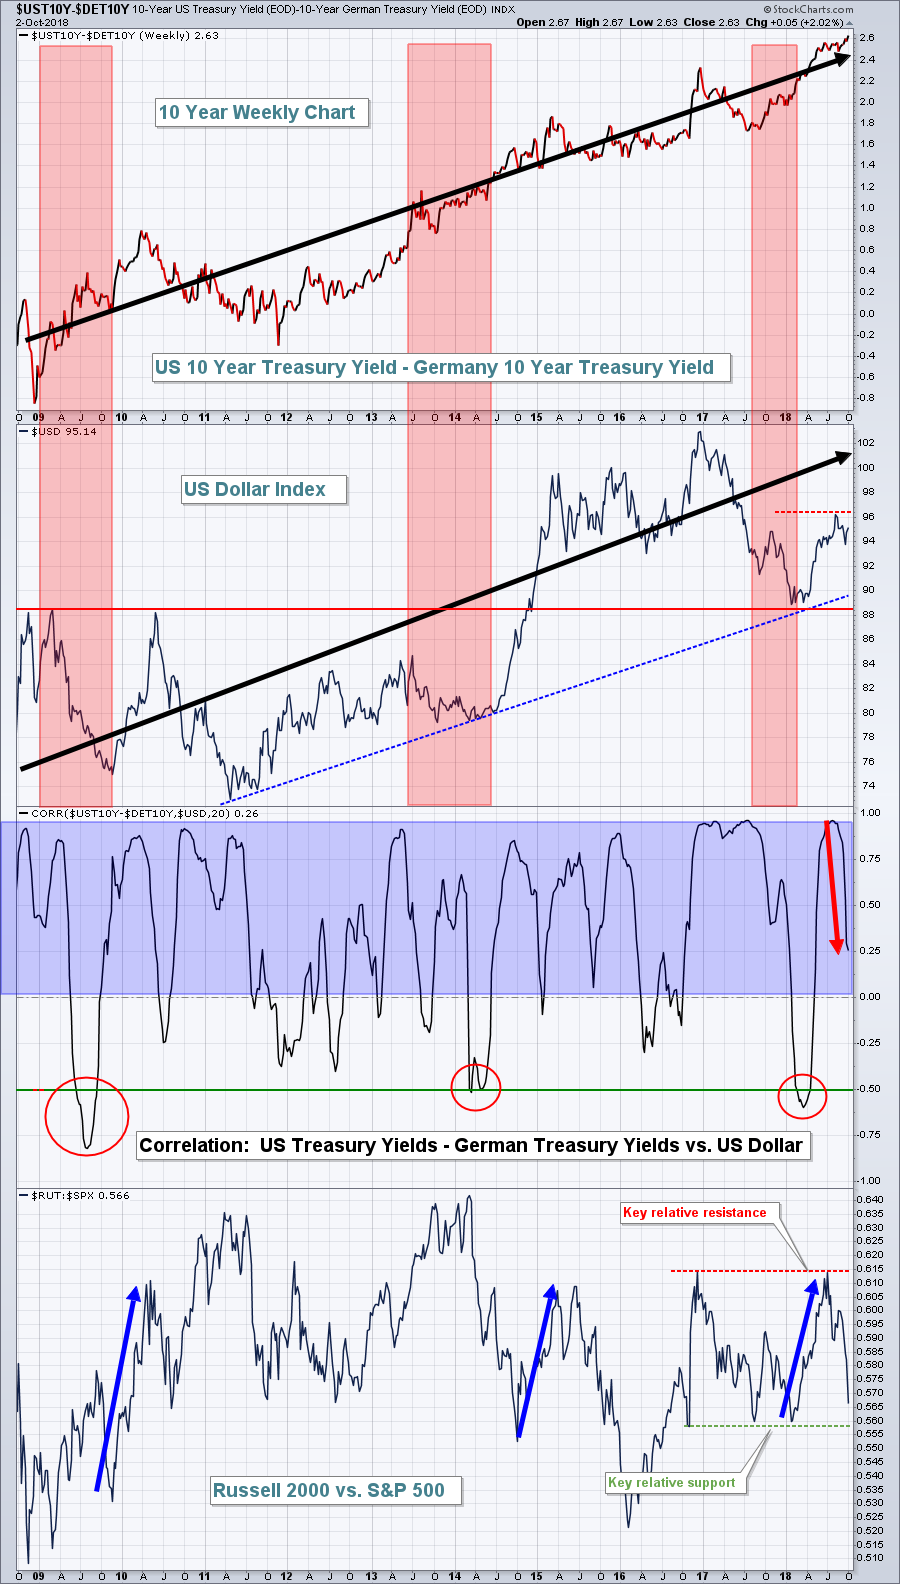 The most recent breakout in the UST10Y-DET10Y has not been accompanied by a new high in the USD, but I believe it's only a matter of time before that USD breakout occurs. Taking that a step further, the Russell 2000 vs. S&P 500 (RUT:SPX) generally trends higher during periods of a rising dollar as that scenario results in foreign currency translation losses for the multinational companies found on the S&P 500, while small caps are not generally affected by dollar swings as these are primarily domestic companies with most or all of their business in the U.S.
While these relationships are not perfect, they do make a lot of common sense. While I acknowledge that history and perhaps the Monday trade deal between the U.S., Canada and Mexico could be behind the short-term S&P 500 outperformance, I ultimately believe that a stronger dollar will re-ignite small cap stocks later in Q4. For now, I'm watching that relative support line on the RUT:SPX. A reversal there would be bullish for small cap stocks.
Sector/Industry Watch
Apparel retailers ($DJUSRA, -2.50%) had a rough Tuesday, closing at their lowest level in the past six weeks. This industry has provided leadership to the market since breaking out of a base in May 2018. I'm watching to see if we get a reversing candle at important price support:
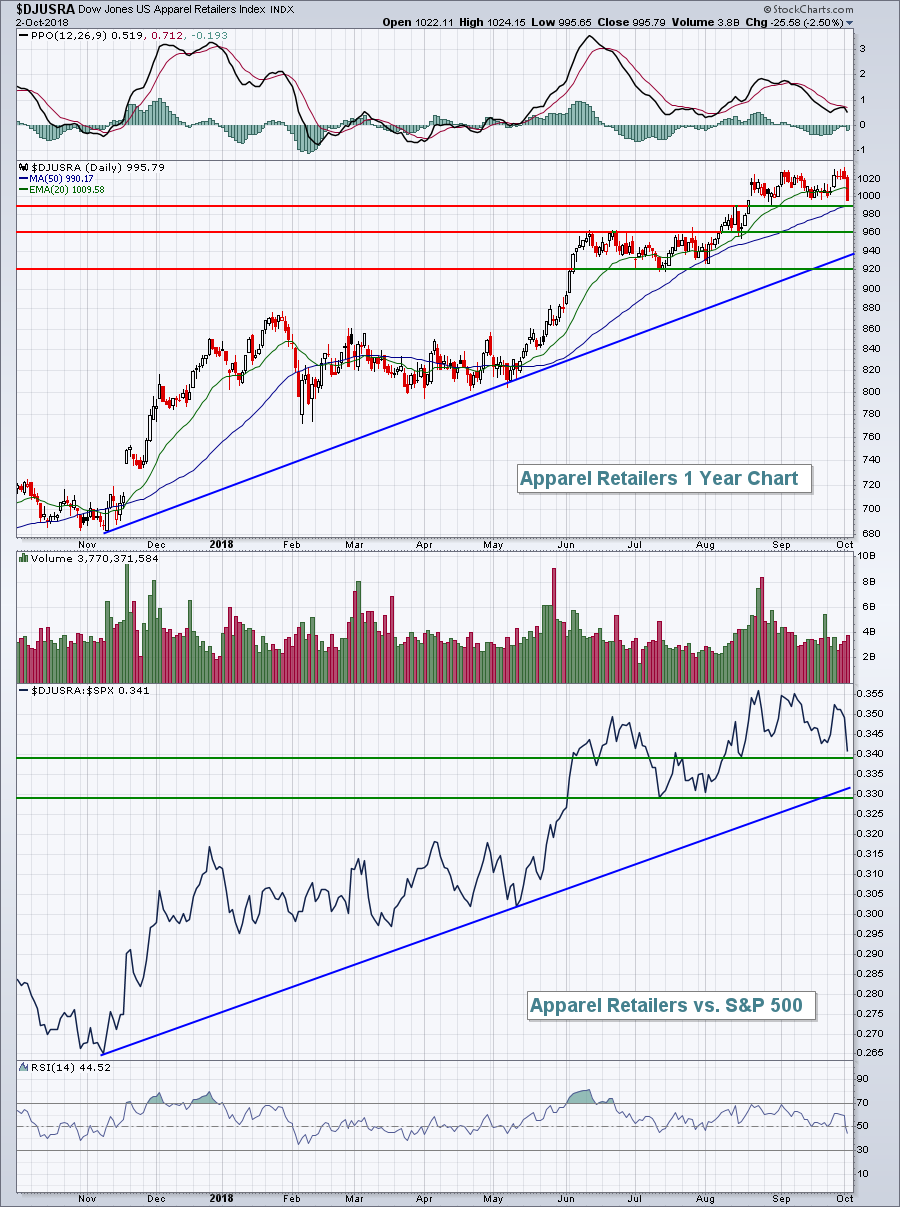 I've provided the three levels of price support on the DJUSRA chart above where I'd be looking for possible recovery. The breakouts that occurred in May and August both were accompanied by heavy volume, suggesting heavy accumulation. Therefore, I'm looking for strength here during Q4, but the short-term rotation out of the group may not be over just yet. A reversing candle (perhaps a hammer or bullish engulfing) would be an indication that the current period of relative weakness has ended. If a reversing candle prints on one of the support levels provided above, all the more bullish.
Historical Tendencies
The first week of all calendar months tend to be quite bullish. Even during October, the S&P 500 produces an annualized return of +38.31% for the first six days of the month. But for some reason, the Russell 2000 ($RUT) struggles to open up Q4. While the 7th through the 9th have historically been the worst for the RUT, the 1st through 6th have not exactly been bullish. The RUT has produced annualized returns of -65.01% for the entire 1st through 9th period.
There are some historical bullish and bearish periods that can be explained and some that cannot. Chalk up the small cap weakness to open up October in the latter camp. I have no idea why money rotates out of small caps to open the fourth quarter, but history suggests it happens rather frequently and it's certainly happened to open up 2018 Q4.
Key Earnings Reports
(actual vs. estimate):
AYI: 2.63 (estimate - still awaiting results)
LEN: 1.40 vs 1.20
RPM: .52 vs .86
Key Economic Reports
September ADP employment report released at 8:15am EST: 230,000 (actual) vs. 179,000 (estimate)
September PMI services index to be released at 9:45am EST: 52.9 (estimate)
September ISM non-manufacturing index to be released at 10:00am EST: 58.0 (estimate)
Happy trading!
Tom
