Special Note
I will be speaking to the Charlotte Chapter of the American Association of Individual Investors (AAII) this Saturday, October 13th at 10:00am EST. I plan to discuss how to evaluate the sustainability of a bull market, relative strength and gap trading strategies. The first meeting is FREE to non-members, so if you're in the Charlotte area, please stop by and say hello! For more information, CLICK HERE.
Market Recap for Tuesday, October 9, 2018
Energy shares (XLE, +0.89%) were in favor on Tuesday as crude oil prices ($WTIC) once again neared the $75 per barrel level. Less than two months ago, the WTIC was at $65 per barrel. The $10 per barrel price has triggered a very nice rally in the XLE. Its one month rally of 7.59% more than triples that of the next best sector healthcare (XLV, +0.17%), which has climbed 2.41% over the past month. Energy has been providing both the Dow Jones and S&P 500 a relative lift over its more aggressive peers, the NASDAQ and Russell 2000. The NASDAQ 100 does not feature a single energy stock.
Exploration & production ($DJUSOS, +1.18%) once again paced the energy sector. This group looks great technically and appears poised for further gains, especially if the XLE can negotiate overhead price resistance at 78:
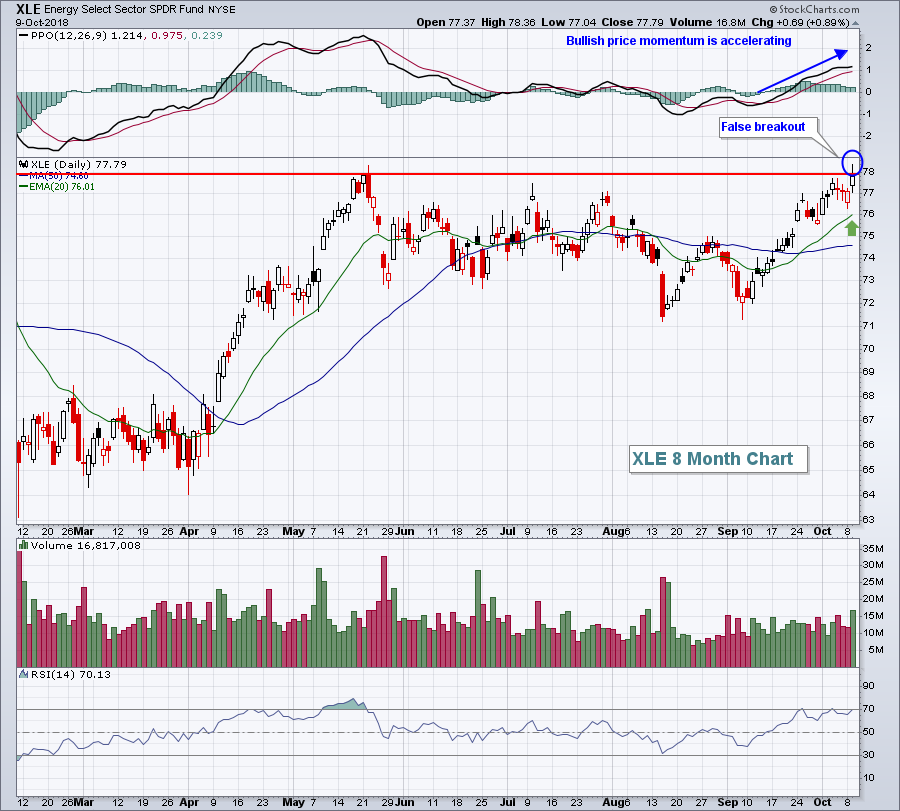 Short-term, I'm a bit concerned at yesterday's failed breakout attempt (blue circle), but price momentum here is extremely bullish suggesting that any pullback to the rising 20 day EMA (green arrow) would be a great opportunity for entry.
Technology (XLK, +0.36%) finally saw a bit of relief after a three session beat down. Software ($DJUSSW, +0.39%) posted minor gains, but the primary technology strength came from computer hardware ($DJUSCR, +1.11%), which has held up extremely well on a relative basis as Apple (AAPL) continues to perform well into its upcoming quarterly earnings report.
Pre-Market Action
The 10 year treasury yield ($TNX) is up two basis points this morning to 3.23%, which continues to give investors pause - or at least give the media something to spread fear about. A ton of money is leaving the bond market and currently is sitting on the sidelines, or perhaps moving into energy shares. Riskier areas of the market haven't seen much money rotating towards them, at least not yet.
We saw slight gains overnight in Asia, while selling this morning is once again gripping Europe. That selling has carried over to the U.S. as futures are preparing for another weak open. Dow Jones futures are down 57 points as we await the opening bell. NASDAQ futures are showing relative weakness again this morning.
Current Outlook
The S&P 500 is residing on very important short-term support. Given the negative divergence that printed on its daily chart on the September high, I'd argue the trip back to test the 50 day SMA was to be expected. Not only is this key moving average being tested, but the current price level also represents key price support:
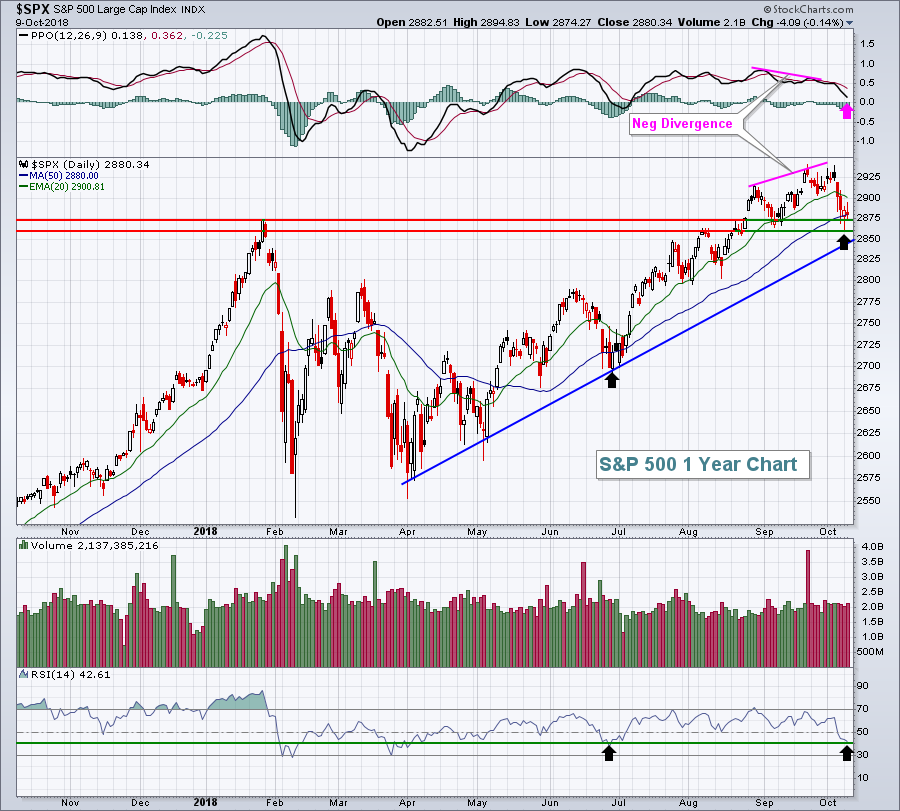 The January 2018 high close was 2873. Since breaking above that level in August, we have not had a single close beneath it. There's intraday price support at 2862 from Monday's low and trendline support closer to 2850. So we've got a number of technical reasons for the S&P 500 to bottom in this 2850-2875 area. Throw in the RSI 40 support level, which tends to provide excellent support during uptrends, and I'd say we're now testing critical short-term support.
Sector/Industry Watch
Drug retailers ($DJUSRD) remain 15% or so off of their January 2018 high, but the short-term strength is apparent on their chart:
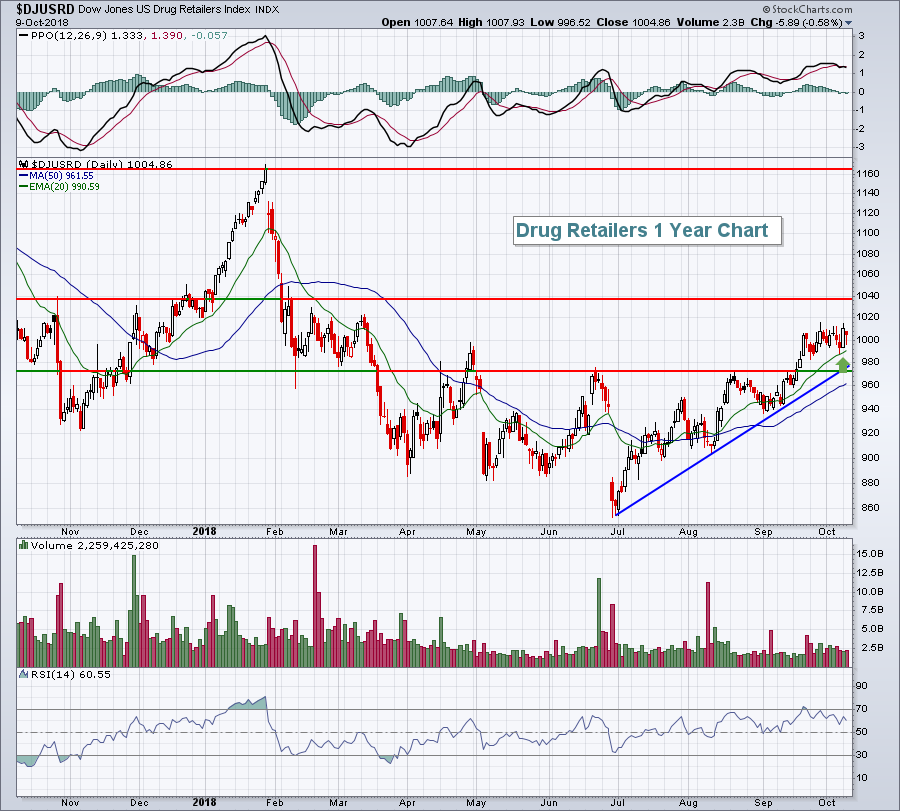 Over the past month, the DJUSRD has been one of the top performing industry groups, gaining 5.91%. While the uptrend is clear and supported by a rising trendline, the 1040 reaction price high in early February may prove to be difficult resistance to overcome.
Historical Tendencies
Over the past 20 years, Goldman Sachs (GS) has risen 16 times during the month of October, averaging monthly gains of 4.8% over that span. Q4 has produced average returns of 9.7% over the past two decades. Technically, GS has been under selling pressure and hasn't been a good relative performer amongst its peers:
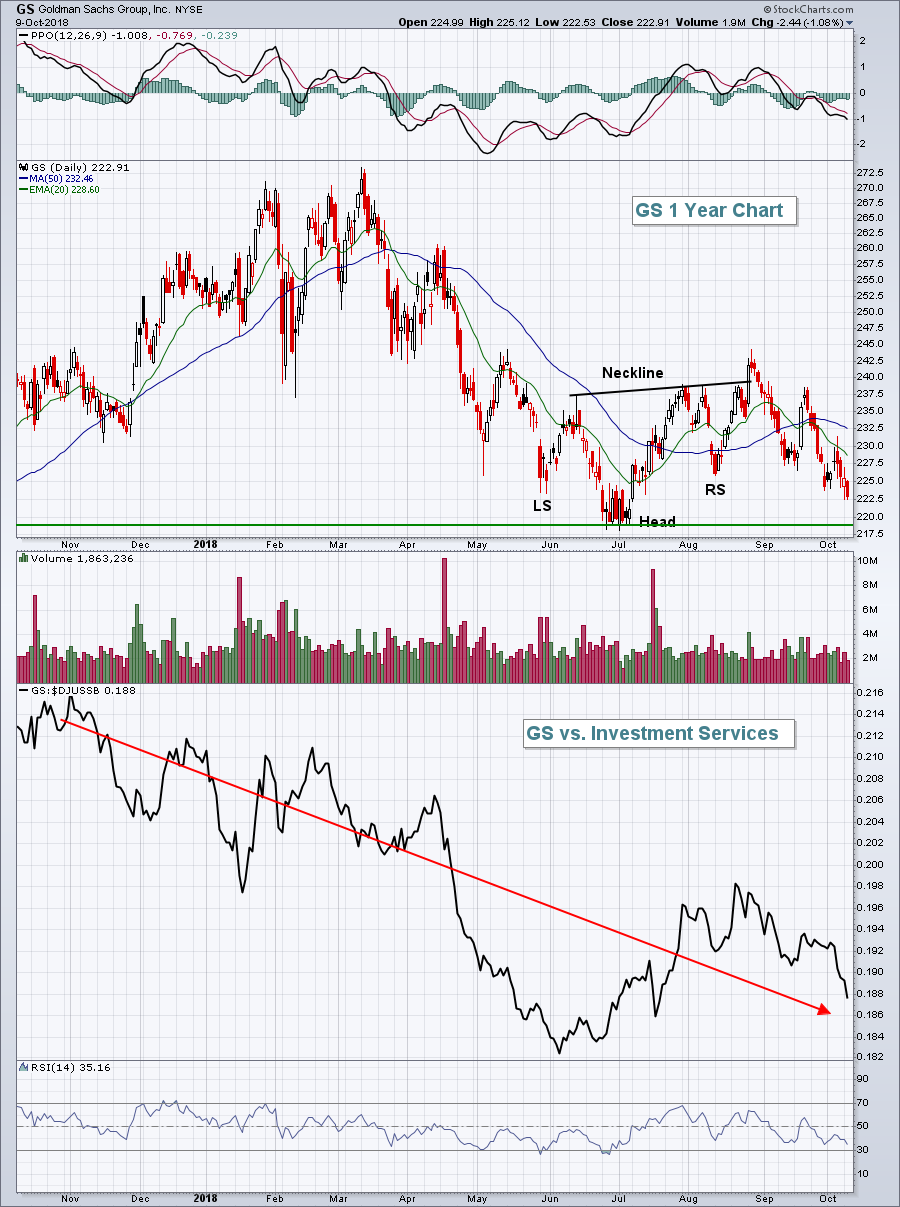 Seasonality favors a long position in GS, but technical analysis does not. GS could be a possibility on a reversal near price support below 220. Otherwise, this is a case where technical conditions simply trump historical tailwinds.
Key Earnings Reports
(actual vs. estimate):
FAST: .69 vs .67
Key Economic Reports
September PPI released at 8:30am EST: +0.2% (actual) vs. +0.2% (estimate)
September Core PPI released at 8:30am EST: +0.2% (actual) vs. +0.2% (estimate)
August wholesale inventories to be released at 10:00am EST: +0.8% (estimate)
Happy trading!
Tom
