Special Note
I will be joining John Hopkins, President of EarningsBeats.com, for a special webinar later this afternoon at 4:30pm EST. I will be discussing my trading strategy during a volatile market like the one we have now, including some tips and tricks to manage risk during these crazy gyrations. I'll also be sharing my latest Strong Earnings ChartList, which has been trimmed down substantially, to all those that attend and are StockCharts.com members (you must be a StockCharts.com member to be able to download the ChartList). The webinar also requires a membership to EarningsBeats.com, but they're offering a FREE one week trial in order for you to attend this afternoon's webinar. CLICK HERE to sign up.
This will be a very important webinar as we head into the remainder of Q4 - a bullish period historically - with a ton of angst. I look forward to seeing you there!
Market Recap for Friday, October 19, 2018
We closed out Friday with bifurcated action. Unfortunately, the weakest part of the market was represented by risk-on areas. The NASDAQ and Russell 2000 lost 0.48% and 1.20%, respectively. Meanwhile, the S&P 500 lost just 1 point and the Dow Jones was actually able to close with a 65 point gain. Perhaps the worst action, though, was in consumer stocks where staples (XLP, +2.28%) dominated discretionary (XLY, -0.98%). That's more than a 3 percentage point swing, which we don't see very often. Market participants made a statement on Friday and it wasn't a good one. We're in a correction, maybe worse. But I'm sticking with correction for now as I explain in the Current Outlook section below.
Semiconductors ($DJUSSC, -1.80%) had another rough session and one of its most beloved stocks, Advanced Micro Devices (AMD), fell more than 10% last week, including a horrible Friday where it lost more than 11%. On the flip side, consumer staples saw leadership from the nondurable household products group ($DJUSHN, +7.65%) as Proctor & Gamble (PG) was easily the best performing Dow Jones component and among the leaders on the S&P 500 as well. PG posted better-than-expected quarterly earnings results and blew past price resistance on heavy volume:
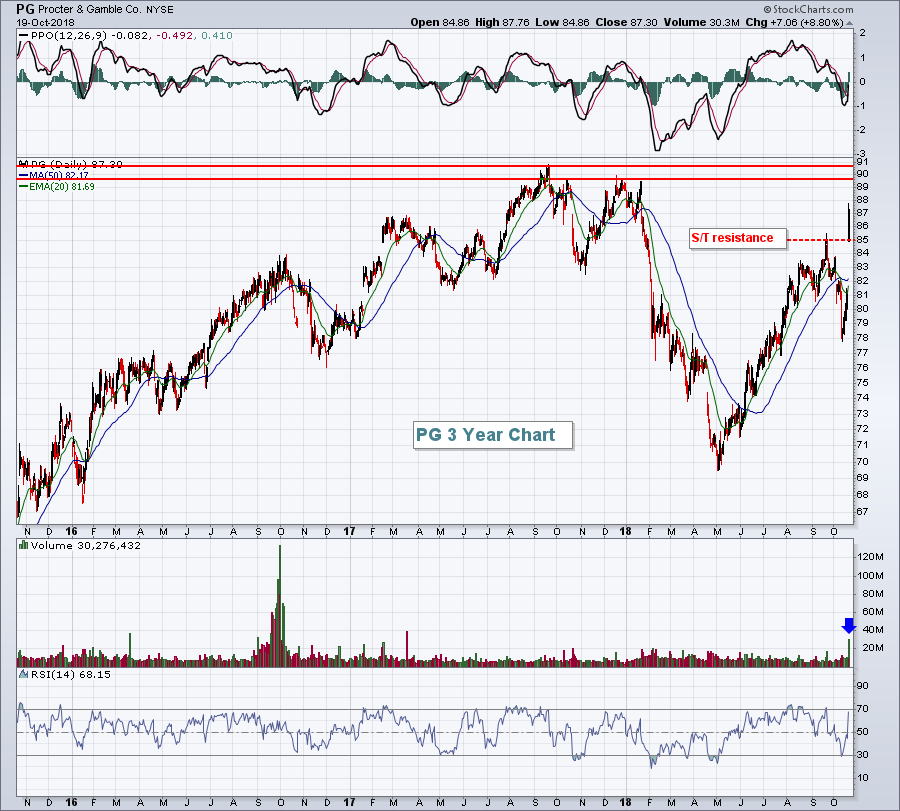 Not only did PG post nice results, but it is also now in an area of the market that is favored by traders. I'd look for PG to make a run at its 2017 high near 91.
Pre-Market Action
Perhaps the biggest news this morning is China's Shanghai Composite ($SSEC) gaining more than 4% overnight. European stocks are also up modestly. U.S. stocks look to begin the week in positive territory as Dow Jones futures are currently higher by 100 points with less than 30 minutes left to the opening bell.
Current Outlook
Last week, the S&P 500 finished almost exactly where it had finished the prior week. It moved from 2767.13 to 2767.78, a weekly gain of .65 points. But the intraweek swing from high to low was approximately 2.5%, a fairly volatile week by normal standards. We're in no normal period, however. Digging a little deeper, we begin to see the real problem. Here was the weekly sector leaderboard:
Consumer staples (XLP): +4.41%
Real estate (XLRE): +3.28%
Utilities (XLU): +3.06%
....and the losers:
Energy (XLE): -2.01%
Consumer discretionary (XLY): -1.97%
Materials (XLB): -1.23%
Technology (XLK): -1.16%
On the surface, it appeared that the stock market was simply flat. But all of us need to recognize that significant rotation took place last week into defensive-oriented areas of the market as traders shunned riskier areas. This rotation from aggressive to defensive areas is typical of both corrections and bear markets, so I wouldn't jump the gun and call this a bear market. But being long a correction or a bear market will result in the same thing - short-term losses.
The XLY:XLP ratio is important to me as our GDP is roughly 2/3 consumer spending. Therefore, it's important to monitor which area of consumer stocks is performing best. Short-term we have issues. Long-term, I'm not so worried....yet. Here's the visual:
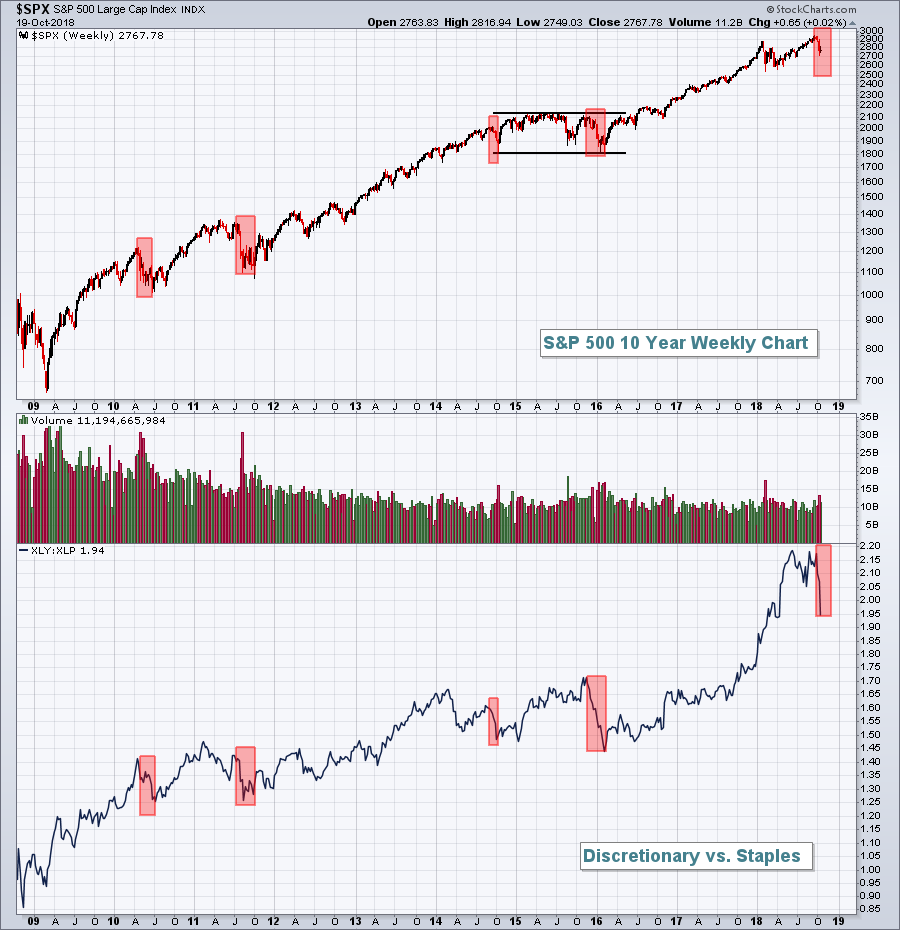 My point with this chart is that rotation from the XLY to the XLP is normal during corrections. We've seen that several times throughout the current bull market. That rotation was NOT a signal for a bear market. But I'm looking at the current market action in much the same way I viewed the market action in 2015 and 2016. We're consolidating significant gains and "easy money" is over for now.
The rotation from discretionary to staples is much, much more bearish when it takes place during market uptrends, not downtrends. That's what we saw back before the 2007 top. I still view the XLY:XLP chart above as bullish. But a further relative pullback is likely before we find a market bottom.
Sector/Industry Watch
Financial administration stocks ($DJUSFA) is typical of what we're dealing with in the U.S. stock market right now - a fallen leader that's now displaying bearish technical actions. Downtrends many times are characterized by failures to clear declining 20 day EMAs just as uptrends tend to hold this key moving average during pullbacks. Check out the DJUSFA chart:
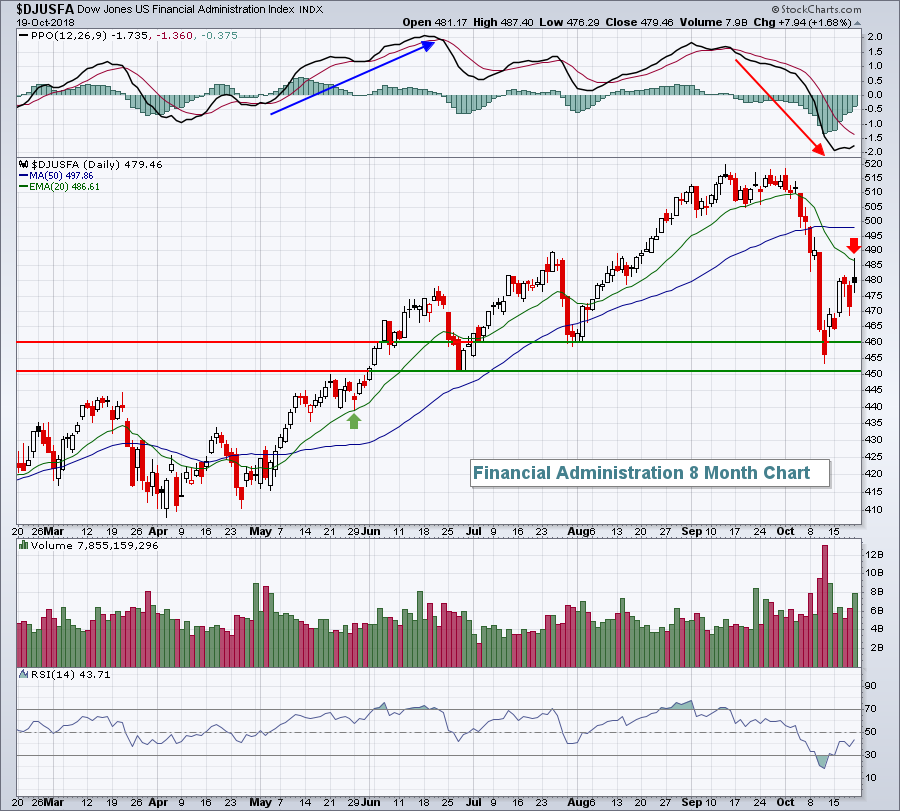 Do you see how the technical conditions have flipped? When the PPO is accelerating higher, it means that bullish price momentum is building. The rising 20 day EMA (green arrow) provides support. But when the PPO is accelerating lower, it means that bearish price momentum is building. The declining 20 day EMA (red arrow) provides resistance. The table has been turned on the bulls and we'll likely need some patience and avoid overtrading trying to catch bottoms.
Monday Setups
I'm going to pass on setups for a second straight week. High volatility readings ($VIX > 16-17, especially above 20) suggest big swings in both directions with an emphasis to the downside. I don't short stocks during bull markets and trading on the long side is dangerous when impulsive selling begins.
Here's a perfect example. On MarketWatchers LIVE last Monday, I provided Advanced Micro Devices (AMD) as my Monday "pick". It was trading at 26.39 at the time. If your timing was impeccable, you could have sold AMD at 28.53 on Wednesday morning, a gain of roughly 8%. But if you held it through Friday's close, you'd have been down more than 10% as AMD closed at 23.66. So AMD lost nearly 5 bucks from Wednesday morning through Friday's close, or approximately 17%. When I talk about dangerous trading, this is what I'm referring to. You either need to be psychic or psycho to short-term trade given this highly volatile market. No thanks, I'll pass.
Historical Tendencies
This is the one week where I cringe every year. Maybe 2018 will be different. But history tells us to be very cautious this week. Here are the NASDAQ's annualized returns since 1971 by calendar day for this bearish historical period:
October 22 (today): -57.28%
October 23 (tomorrow): -51.63%
October 24 (Wednesday): -49.83%
October 25 (Thursday): -78.61%
October 26 (Friday): -76.62%
October 27 (Saturday - thankfully market closed): -77.69%
Perhaps we can look back to the recent weakness and argue that the upcoming historical weakness simply arrived a little early this year. Perhaps. Or maybe we should argue that it's just begun. Either way, I'll be cheering from the sidelines.
Key Earnings Reports
(actual vs. estimate):
HAL: .50 vs .49
HAS: 1.93 vs 2.24
IQV: 1.42 vs 1.39
KMB: 1.71 vs 1.64
PII: 1.86 vs 1.57
(reports after close, estimate provided):
AMTD: .88
CDNS: .41
ZION: .96
Key Economic Reports
None
Happy trading!
Tom
