Market Recap for Thursday, October 25, 2018
Obviously, the numbers from Thursday tell us that we had a very strong day. But the "under the surface" signals really underscored that strength. Transports ($TRAN) gained 1.88% after nearly touching the February low. Technology (XLK, +3.44%), communication services (XLC, +3.31%) and consumer discretionary (XLY, +3.01%) - three key aggressive sectors - were the clear leaders as buyers adopted a "risk on" attitude, even if only for a day. Financials (XLF, +1.55%) also were strong after a torturous 12% decline that began only a month ago:
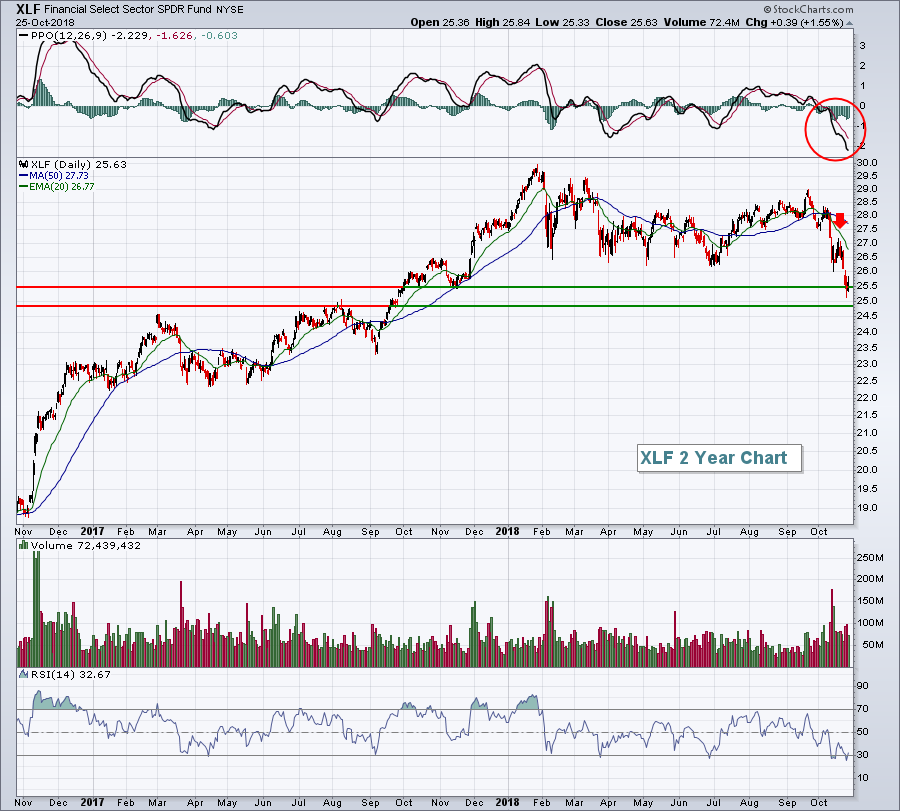 I am by no means suggesting that financials are a healthy group, because they're clearly not. But....the XLF did venture into a zone where I could see a potential reversal on the daily chart. And the hourly chart on the XLF suggests we could see a positive divergence develop on the next low:
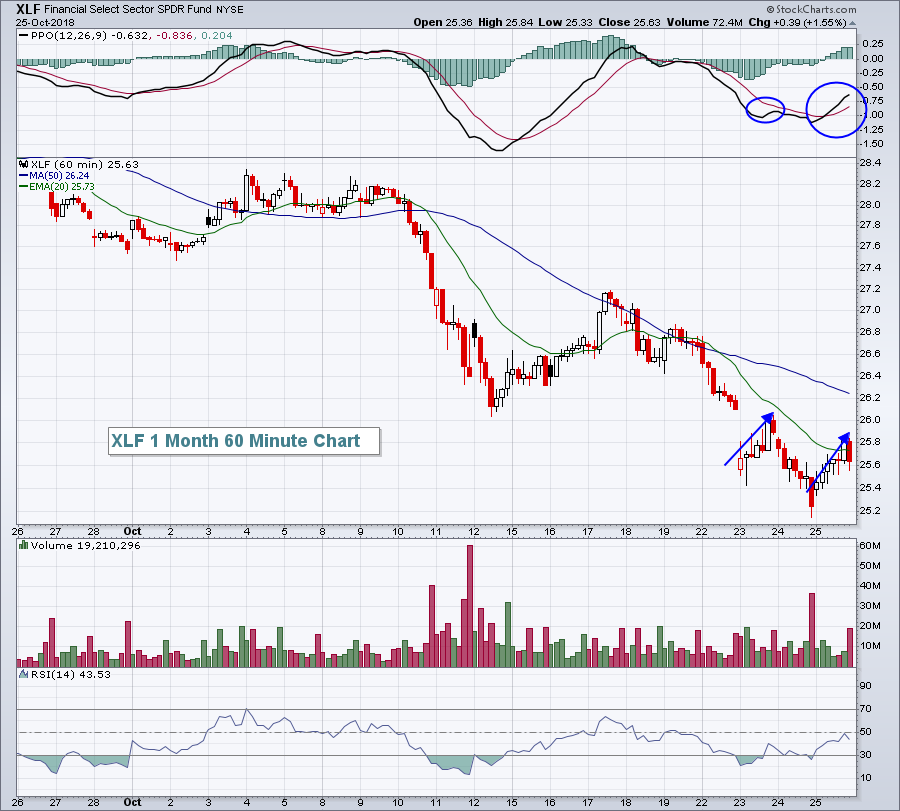 The PPO has reacted much stronger to the latest strength, which is at least a short-term positive. Watch the volume on any fresh new low. If the volume dries up, then I'd begin to think the next big move would be to the upside on financials as the group is likely sold out on the recent big decline.
Defensive groups certainly took it on the chin yesterday. Utilities (XLU, -1.56%) saw some much-deserved profit taking as the 10 year treasury yield ($TNX) continues to hold its support near 3.10%-3.11%.
Pre-Market Action
The 10 year treasury yield ($TNX) is down 4 basis points today and is currently just beneath its 3.11% support level despite a stronger-than-expected Q3 GDP number this morning. Asian markets were unable to gain strength overnight and European markets are lower this morning.
Disappointing earnings (AMZN, GOOGL, Colgate - CL, Moody's - MCO) are topping the headline news this morning and futures are reeling. Dow Jones futures are down 178 points, or 0.72%, but NASDAQ futures are taking the brunt of the selling, dropping 132 points, or 1.92%. Will the latest drop in AMZN attract buyers? Drops in AMZN usually do and the answer to this question could go a very long way towards determining how we close out the week.
Current Outlook
Fear, panic and a massive rotation into defensive stocks have been the three major themes of October thus far. Until these themes change, stay away from U.S. equities. It's that simple. To visualize what I'm talking about, check this out:
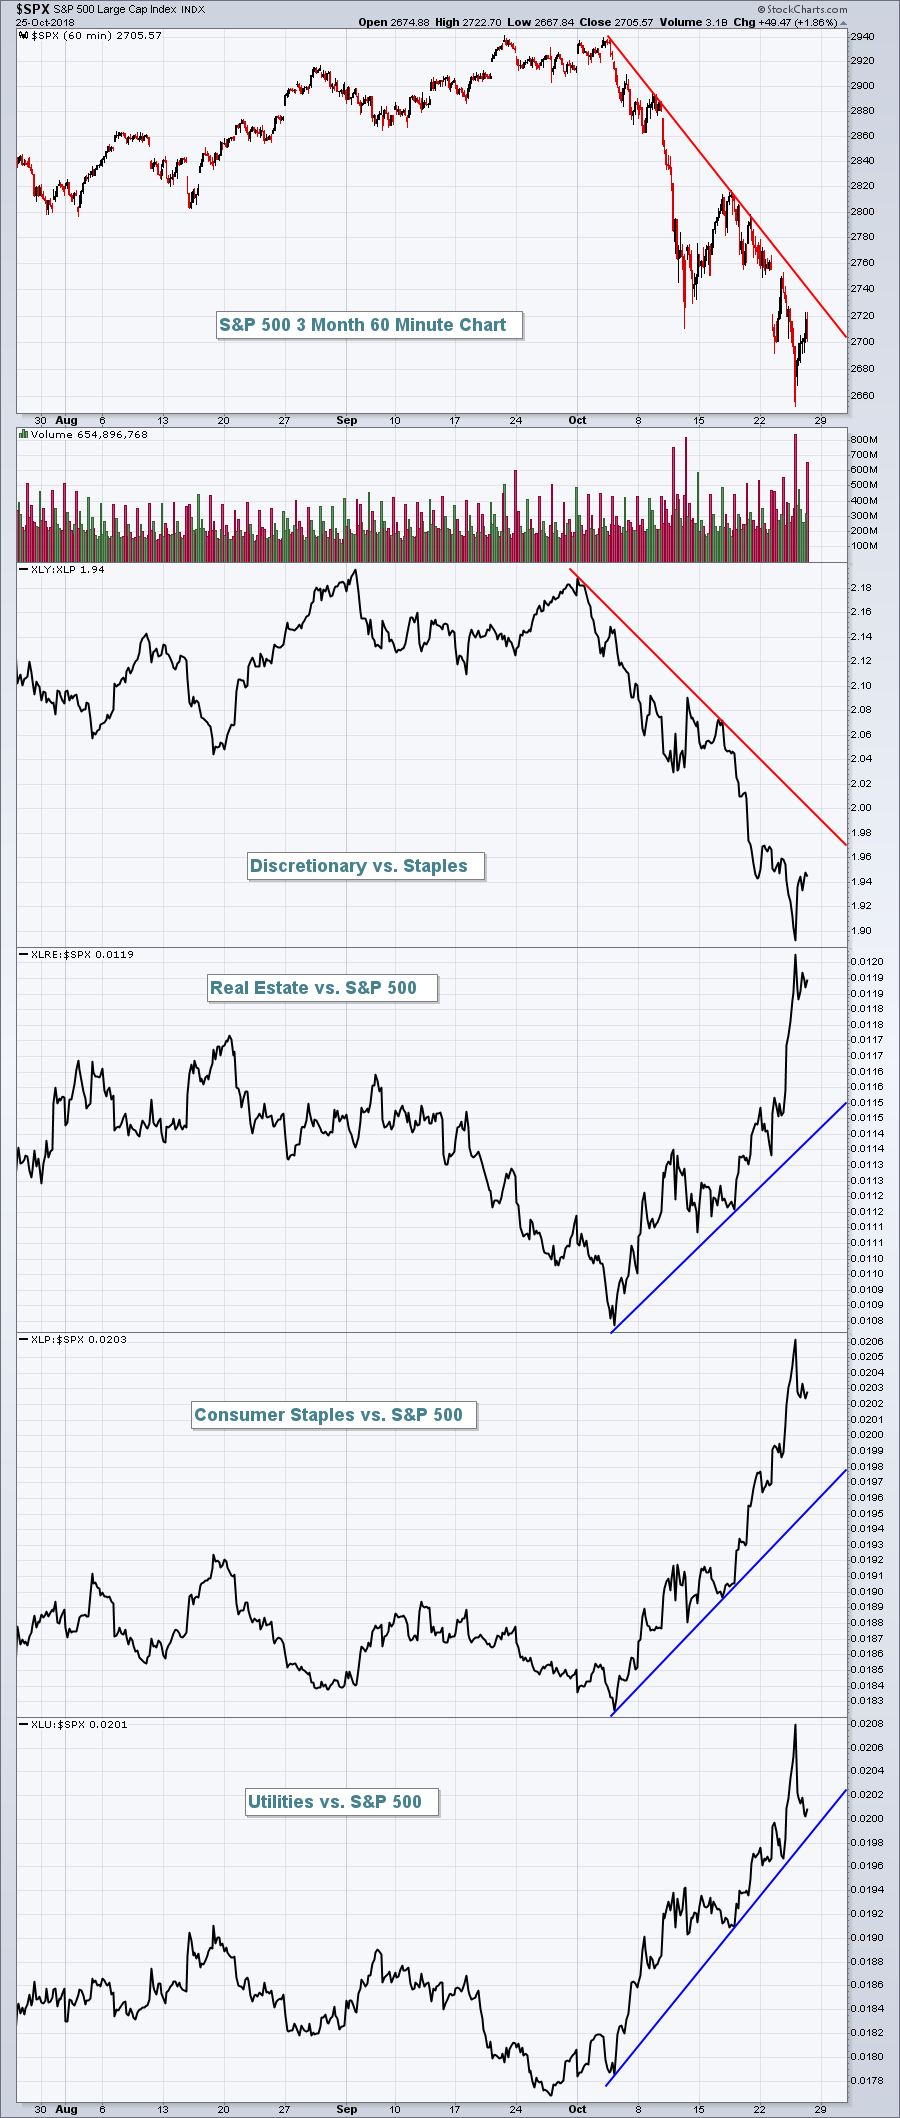 That is a very steep downtrend on the S&P 500 and we're extremely oversold near-term, so I'm beginning to expect a bounce. We'll likely see another big gap lower this morning as Amazon.com (AMZN) and Alphabet (GOOGL) both reported quarterly results last night that disappointed investors. The stock market usually operates on a "sell the rumor, buy the news" type of mentality during downtrends (the opposite during uptrends). This is HUGE news with two iconic companies both gapping significantly lower this morning in pre-market trade. If the stock market can recover from this news today, it would be a very bullish short-term signal in my view. Let's see how the market reacts to the early selling.
Confirmation of renewed short-term strength would be seeing a break above the S&P 500's downtrend line, as well as the XLY:XLP downtrend line. Furthermore, look for a break below the uptrend lines for the XLRE:$SPX, XLP:$SPX and XLU:$SPX. These breaks would suggest the short-term psyche of the stock market is turning from "risk off" back to "risk on".
Sector/Industry Watch
As money has rotated to defensive areas of the market the past several weeks, tobacco ($DJUSTB) has been a definite beneficiary. Over the last 30 days, the DJUSTB has been the best performing industry group, rising 8.92%. Here's the current look at the group:
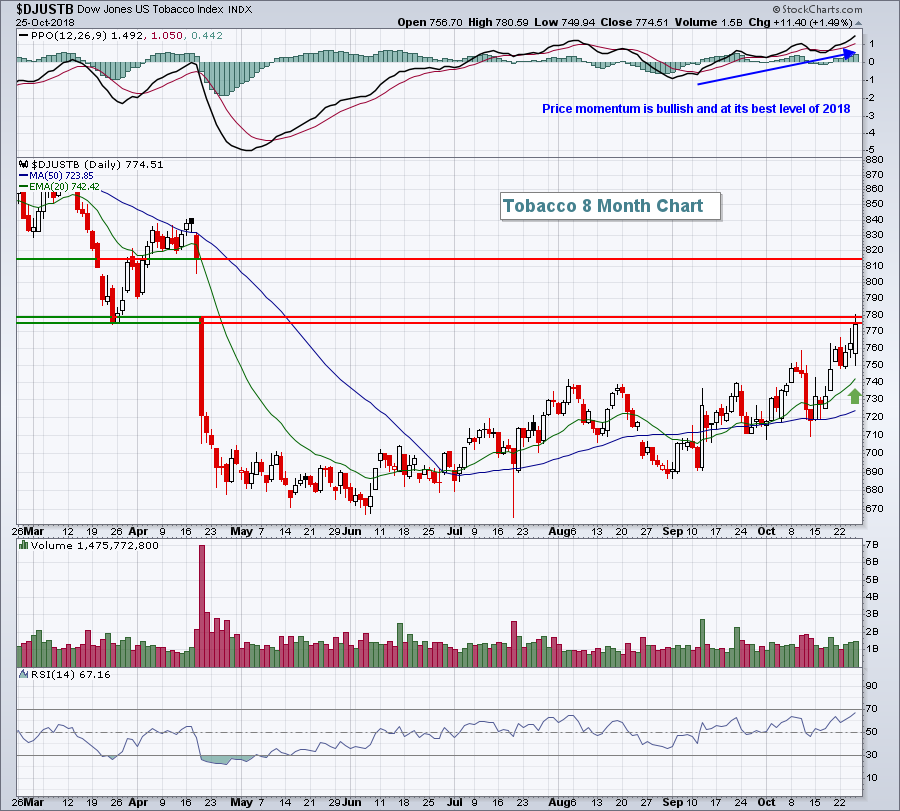 The DJUSTB is at a major technical crossroad as overhead resistance in the form of price and gap resistance is looming. A close above 780 would likely results in the group completely filling the gap back to 815 or so.
Historical Tendencies
Yesterday I provided the historical annualized returns by calendar day for the Russell 2000 during the upcoming bullish period. Today, I'll give you the NASDAQ's annualized returns by calendar day since 1971:
October 28th: +172.44%
October 29th: +73.91%
October 30th: +32.93%
October 31st: +99.34%
November 1st: +17.25%
November 2nd: +131.61%
November 3rd: +90.47%
November 4th: +71.26%
November 5th: +95.87%
November 6th: +22.09%
For the entire 10 day stretch, the annualized return is +80.59% and this is over a 47 year period. I'm not predicting a huge rally next week, simply providing you the facts. There is not a single period throughout the year that comes close to this historical level of bullishness.
Key Earnings Reports
(actual vs. estimate):
AON: 1.31 vs 1.23
CHTR: 2.11 vs 1.05
CL: .72 vs .72
COG: .25 vs .27
MCO: 1.69 vs 1.78
PSX: 3.10 vs 2.50
RBS: .10 vs .19
ROP: 3.09 vs 2.94
SCCO: .48 vs .52
TOT: 1.47 vs 1.45
VTR: .99 vs .97
WY: .28 vs .39
ZBH: 1.63 vs 1.60
Key Economic Reports
Q3 GDP (first estimate) released at 8:30am EST: +3.5% (actual) vs. +3.3% (estimate)
October consumer sentiment to be released at 10:00am EST: 99.0 (estimate)
Happy trading!
Tom
