Market Recap for Friday, December 7, 2018
Friday marked the end of a rough day and a rough week for U.S. equities. Strength was found in utilities (XLU, +0.37%), the only sector to end in positive territory to close out the week. Gold miners ($DJUSPM, +2.36%) and miners ($DJUSMG, +2.00%) helped to alleviate some of the weakness in materials (XLB, -2.41%) as those two groups benefited from a very weak performance by the U.S. Dollar Index ($USD) last week:
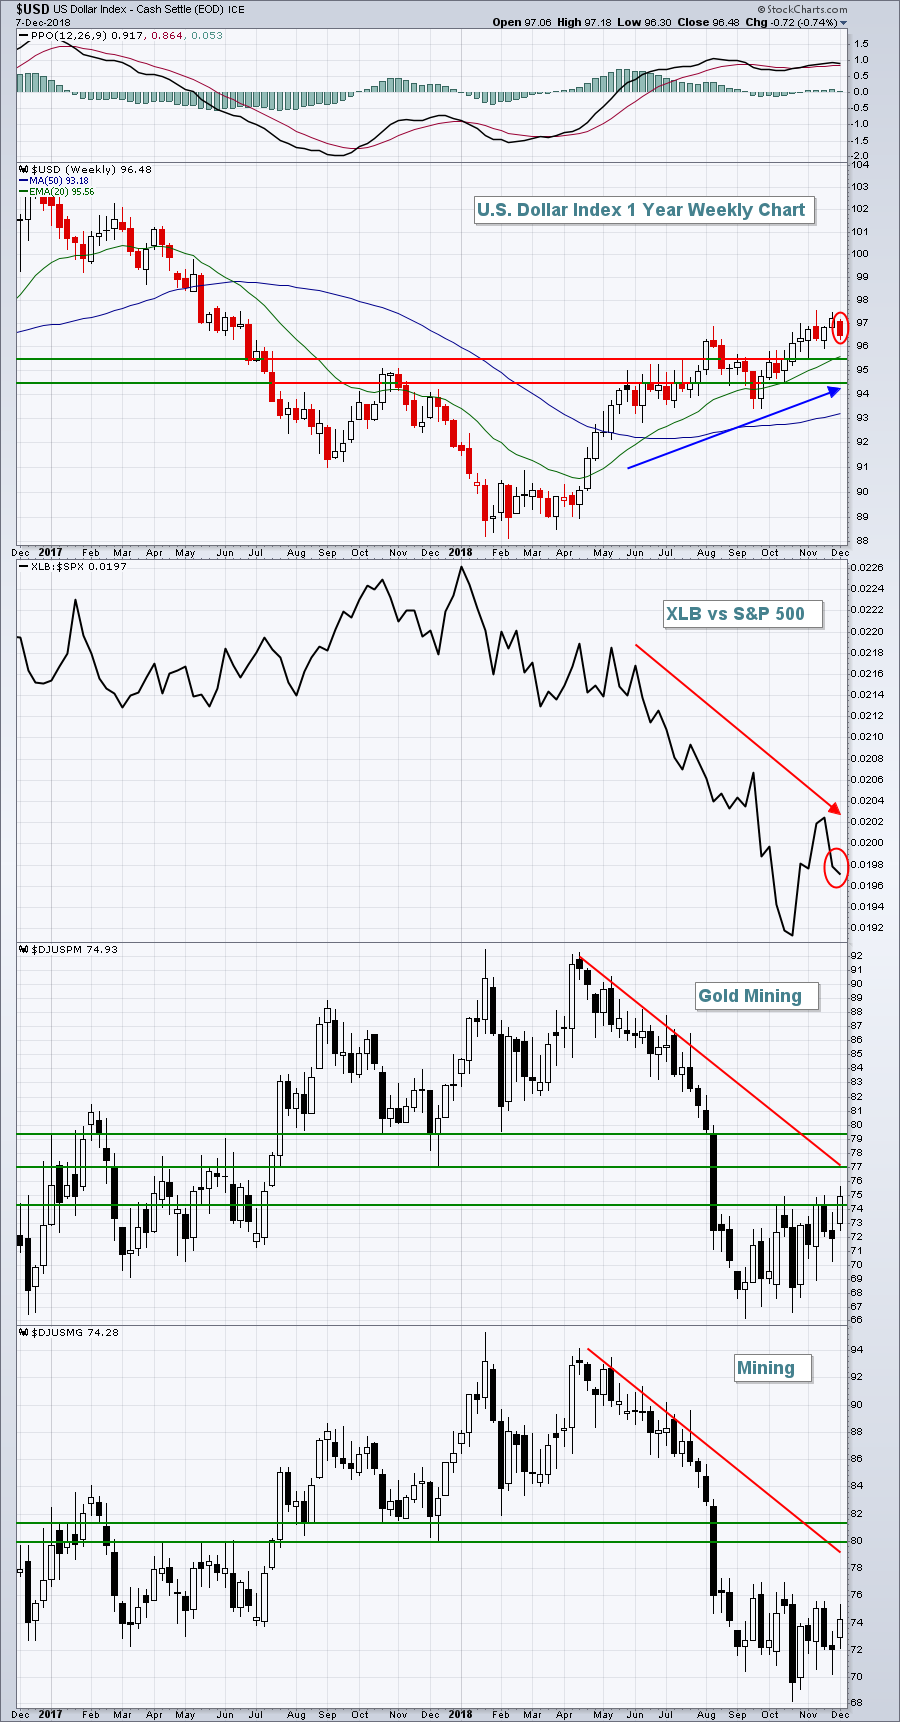 The strengthening dollar has resulted in a weakening materials groups throughout 2018, but dollar weakness last week enabled parts of the materials sector, namely the DJUSPM and DJUSMG, to bounce. As you can see from the above chart, however, there's much more technical work to do.
Technology (XLK, -3.52%), consumer discretionary (XLY, -2.99%) and industrials (XLI, -2.63%) were the primary drivers behind the Friday selloff and the latter sector trailed only financials (XLF) as the worst performing sector of the week. The XLF and XLI dropped 6.90% and 6.22%, respectively, for the week. Transports ($TRAN - see Current Outlook) and heavy construction ($DJUSHV - see Sector/Industry Watch) were two key leaders to the downside in industrials.
Pre-Market Action
Crude oil ($WTIC) is down close to 2% this morning, falling back to $51.60 per barrel at last check. Gold, after a solid advance last week, is down $2 to approximately $1250 per ounce, although a key breakout above $1240 per ounce is in the books.
China reported weak trade data and led a decline overnight in Asian markets. Tokyo's Nikkei ($NIKK) fell 459 points, or 2.12%, to pace the selling there. Europe is mixed this morning as the German DAX continues its decline, trading at its lowest level in two years.
U.S. futures have been volatile overnight, initially down significantly, then turning positive. But they've now crept back into negative territory with the Dow Jones pointing to a slightly lower open.
Current Outlook
As discussed on many occasions, the performance of transports ($TRAN) helps us look into the soul of economic strength. When transports weaken, it's difficult to remain overly optimistic regarding future economic activity. Right now, the TRAN is bordering on a major breakdown, one that would definitely provide a boost for the bears:
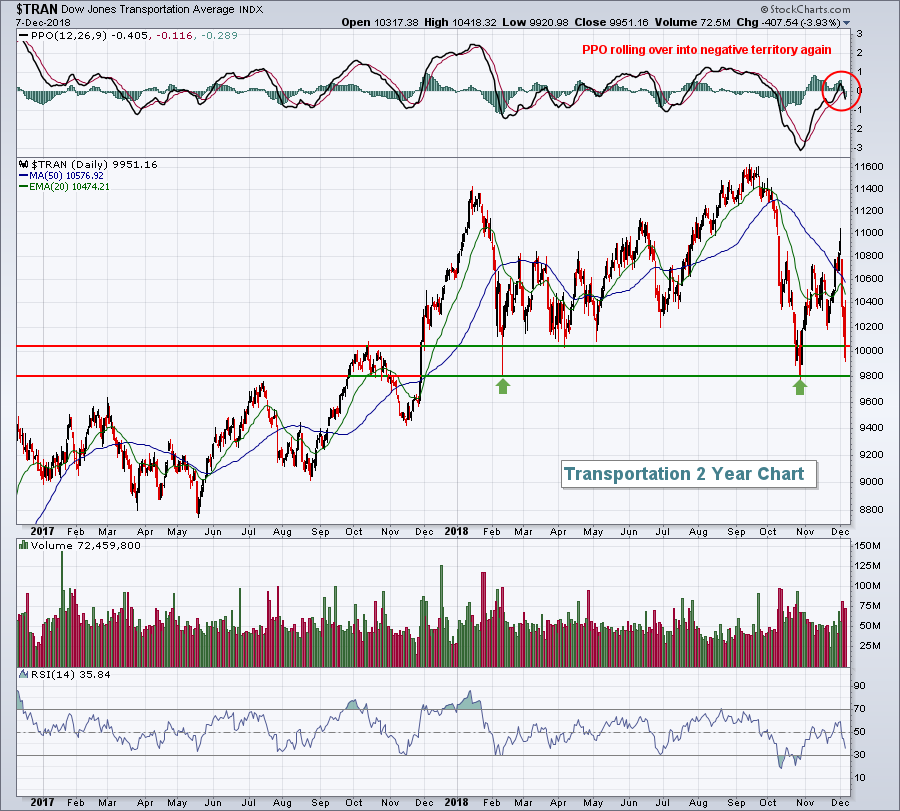 We're currently less than 2% away from a significant breakdown in a critical area of the U.S. stock market. Keep a close eye on this index.
Sector/Industry Watch
Heavy construction ($DJUSHV) lost more than 10% last week alone. 10% represents "correction" territory and this group lost that much in one week. The volatility began during the second week of October when the group began a decline of more than 10%. A solid recovery followed in early November, but the past 3-4 weeks have been brutal for this space:
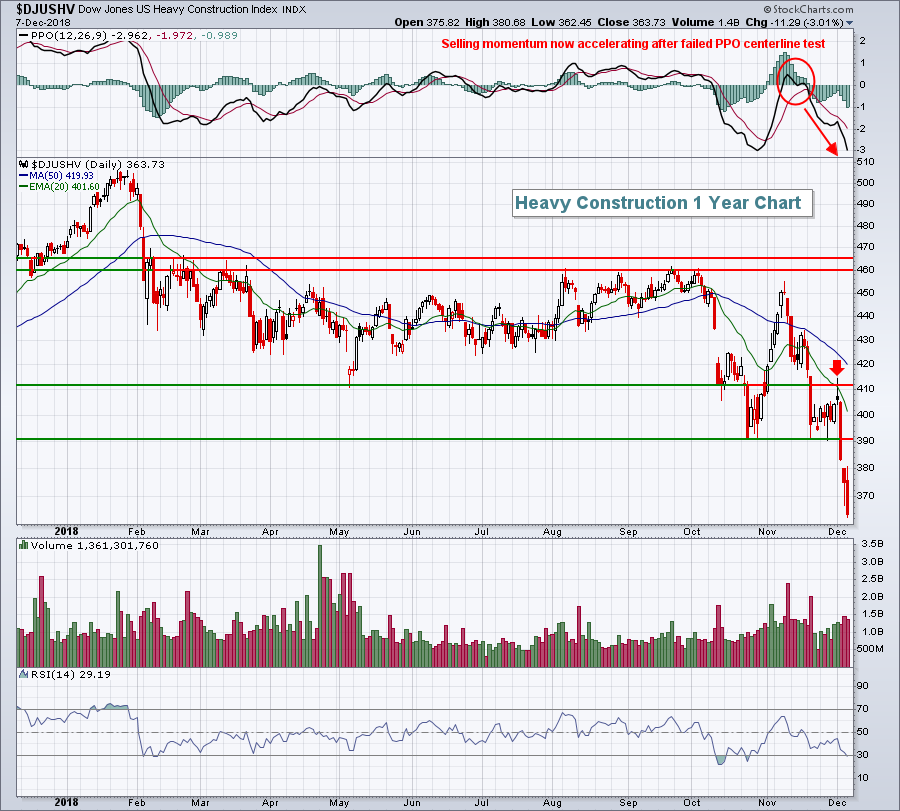 Check out that red arrow, marking the reversal at the declining 20 day EMA. That shooting star candle (looks like an upside-down hammer) was a significant indication that a top was in place. We've seen tons of sellers since with broken support at 390 our new overhead resistance level on a bounce.
Monday Setups
NetEase.com (NTES) reported quarterly results nearly one month ago and they fell short of expectations. The reaction was solid, however, with NTES gapping higher to challenge overhead gap resistance at 236.86. It looked like NTES was breaking out above this resistance on Friday, but a big reversal marked what could be a significant short-term top. Therefore, I like short entry as follows:
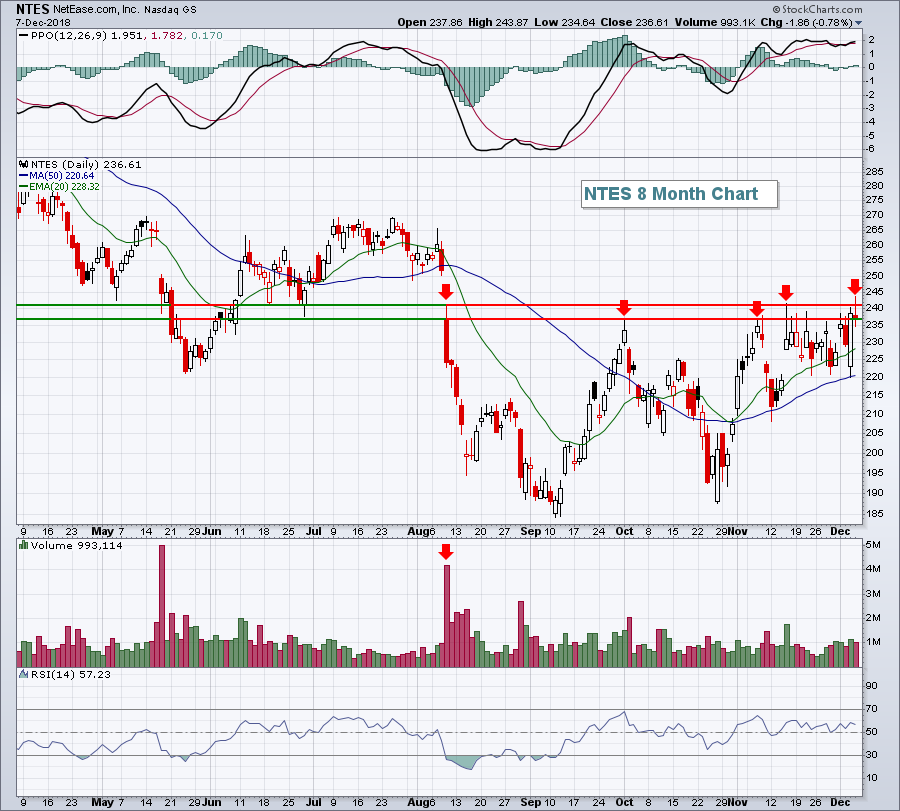 The short-term trading range is from recent price support near 220 and Friday's intraday high of 243.87. Consider a closing stop on any intraday move above 244 and a target of 220 initially. Loss of 220 price support could lead to the recent price low at 185.
All of this week's setups can be seen by CLICKING HERE.
Historical Tendencies
The upcoming week can be challenging seasonally for our major indices. For instance, since 1971 the NASDAQ has produced annualized returns of -51.13% during the period from December 9 through December 15th.
Key Earnings Reports
(reports after close, estimate provided):
CASY: 1.55
SFIX: .03
Key Economic Reports
None
Happy trading!
Tom
