Market Recap for Monday, December 31, 2018
December 2018 was a rough month to end a very difficult Q4. It was very unusual in terms of historical perspective as we're accustomed to seeing mostly solid action in early December followed by a Santa Claus rally into year end. Well, Santa finally did arrive on Wall Street, but many would argue it was a bit too late. U.S. stocks opened last week in horrible fashion, posting the biggest loss ever on Christmas Eve. But by week's end, we had seen rebounds across the board. At Monday's close, the Dow Jones had rallied more than 1500 points off of last week's intraweek low. Still, December ended well below where it started and many market pundits were caught completely off guard. Volatility ($VIX) shot to levels not seen since the early February swoon and that has set the stage for a much more volatile 2019.
During Monday's year end performance, healthcare (XLV, +1.48%) led on a relative basis as biotechnology ($DJUSBT, +1.87%) rose to test very important price and moving average resistance:
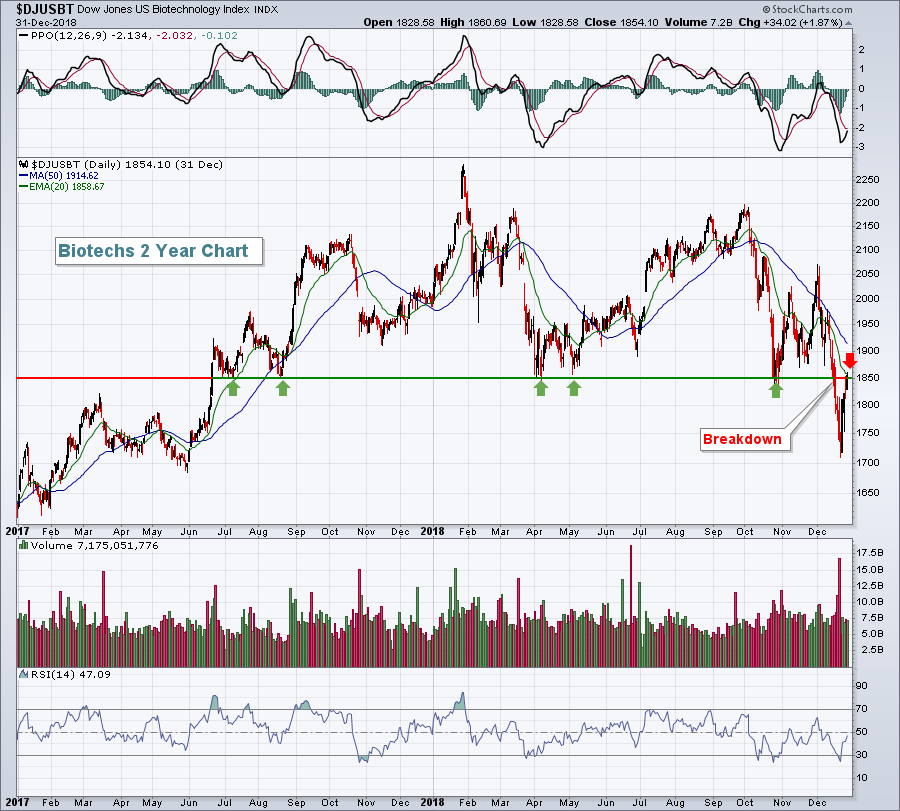 The gains here were not constructive. Instead, we saw a badly beaten-up and technically-challenged group bouncing to a key pivot area. Biotechs look weak to me and have much work to do to repair their chart.
Consumer discretionary (XLY, +1.07%) and industrials (XLI, +1.00%) also closed out the year in positive fashion, but face their own technical hurdles as we move into 2019. Communication services (XLC, +0.15%) was the weakest sector on Monday and trails only energy (XLE, +0.53%) as having the worst SCTR to open up the new year.
Pre-Market Action
The rotation into defensive treasuries continues and will likely keep pressure on U.S. equities as it signals much slower economic activity than what the Fed has been telling us. The 10 year treasury yield ($TNX) is down 4 more basis points to 2.65% this morning. Crude oil ($WTIC) is down another 1.59% to $44.62 per barrel, while gold ($GOLD) trades a bit higher.
U.S. futures are weak, with Dow Jones futures down nearly 400 points with less than 30 minutes to the opening bell. Global markets have begun 2019 on a rough note with major indices in Asia lower overnight. European markets are down this morning as well.
Tesla (TSLA ) is down more than 7% in pre-market after announcing that it came up short in terms of Q4 vehicle deliveries.
Current Outlook
One ratio that I pay close attention to is the Transports vs. Utilities ($TRAN:$UTIL). When our economy is strong or expected to strengthen, money will rotate into the economically-sensitive transportation stocks. But when the opposite is true, money will rotate toward the more defensive utilities group. Monitoring this ratio can provide us one clue as to traders' psyche:
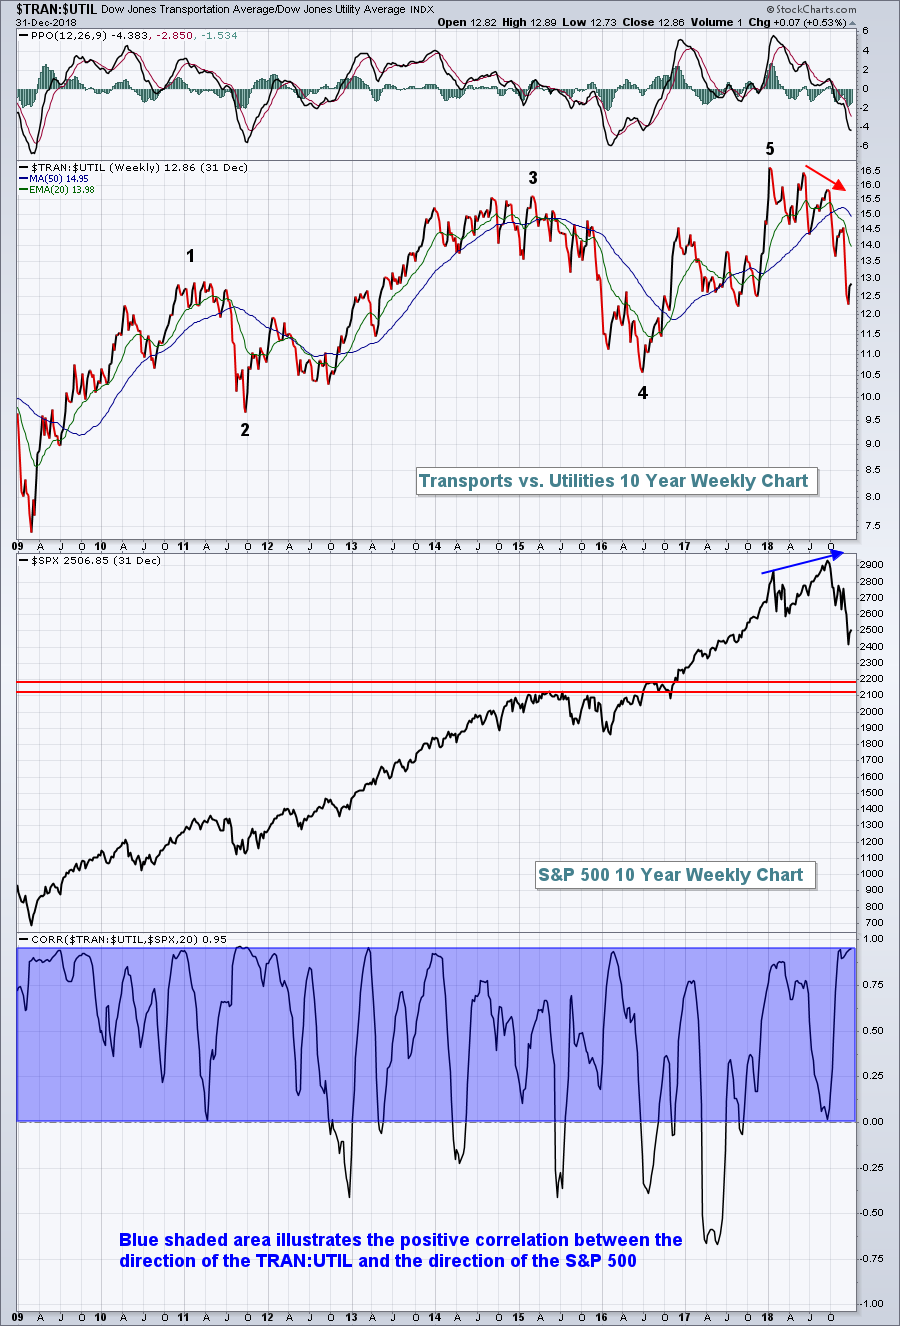 There are a few takeaways here. First, the 1-2-3-4-5 points mark higher relative highs and higher relative lows throughout the decade-long bull market. I think there's a solid chance that this uptrend continues to hold, even throughout a potential bear market in 2019. That aligns well with my belief that we've entered a cyclical bear market within a secular bull market. In other words, once this bear market is over, I fully expect the longer-term bull market to resume in earnest.
Another takeaway is that it's important to follow this TRAN:UTIL ratio. That blue-shaded area above illustrates how closely this ratio moves in relation to the benchmark S&P 500. Finally, I see the 2100-2200 area as a short-term target in 2019, but a rally off that level could mark an important low in the secular bull market.
We will need to be adept at maneuvering in 2019, however, as volatility has returned and we'll likely see big swings in price and emotion.
Sector/Industry Watch
The Dow Jones U.S. Railroads Index ($DJUSRR) is a barometer of our domestic economy and what traders are thinking about our future domestic economic activity. It's not looking good as we enter 2019:
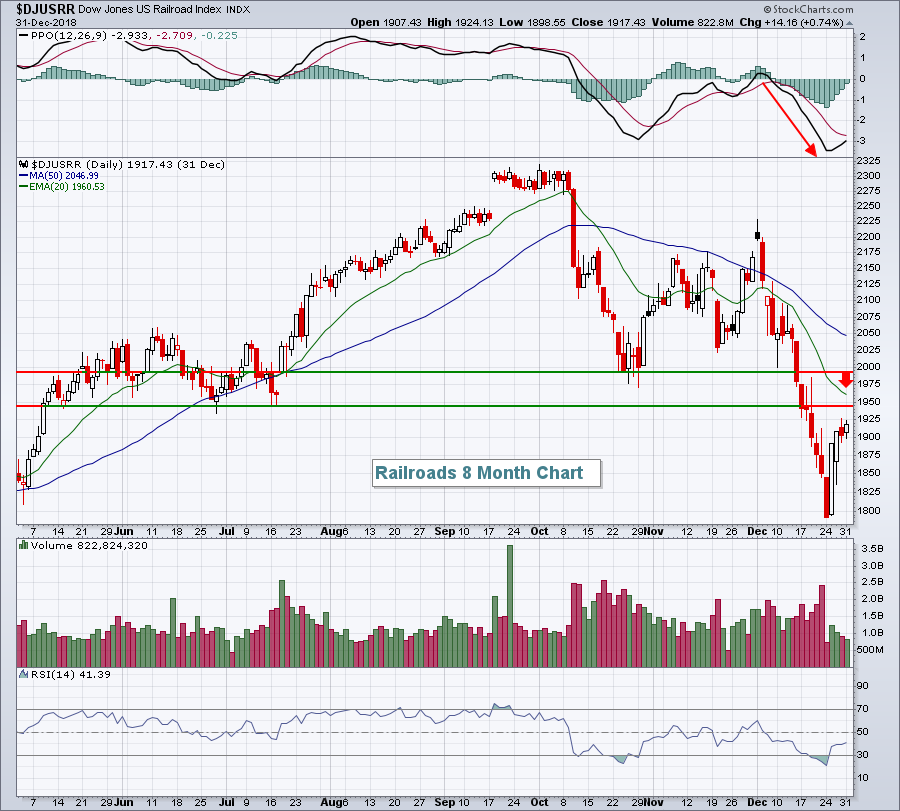 We saw a bounce last week in this group, so upside is likely to be limited. On the above chart, I've highlighted two levels of price resistance, along with the declining 20 day EMA (red arrow). While there's a reasonable chance of a short-term rally to test this area, the potential reward isn't worth the risk of falling back to test recent price lows. The DJUSRR is simply another chart that paints a rather bleak picture as we open up 2019.
Historical Tendencies
The NASDAQ's best calendar month since 1971 has been January, a month in which it's produced annualized returns of +31.72%. It typically gets off to a fast start in January as well, as the following daily annualized performance would suggest:
January 2: +68.93%
January 3: +172.79%
January 4: -32.28%
January 5: +40.60%
January 6: +93.47%
January 7: +17.32%
Key Earnings Reports
None
Key Economic Reports
December PMI manufacturing index to be released at 9:45am EST: 53.9 (estimate)
Happy trading!
Tom
