Market Recap for Monday, January 7, 2019
Crude oil prices ($WTIC, +1.17%) rallied on Monday, helping energy (XLE, +1.49%) continue its recent surge, but the day clearly belonged to consumer discretionary stocks (XLY, +2.26%) as retail (XRT, +3.10%) and home construction ($DJUSHB, +2.43%) were among the session's best performers. It wasn't an across-the-board advance like we've seen in recent days as two defensive sectors, utilities (XLU, -0.68%) and consumer staples (XLP, -0.14%), failed to participate. Also, financials (XLF, +0.12%) struggled on a relative basis as banks ($DJUSBK, +0.18%) hesitated. I'd expect a bit more upside from the banks, though:
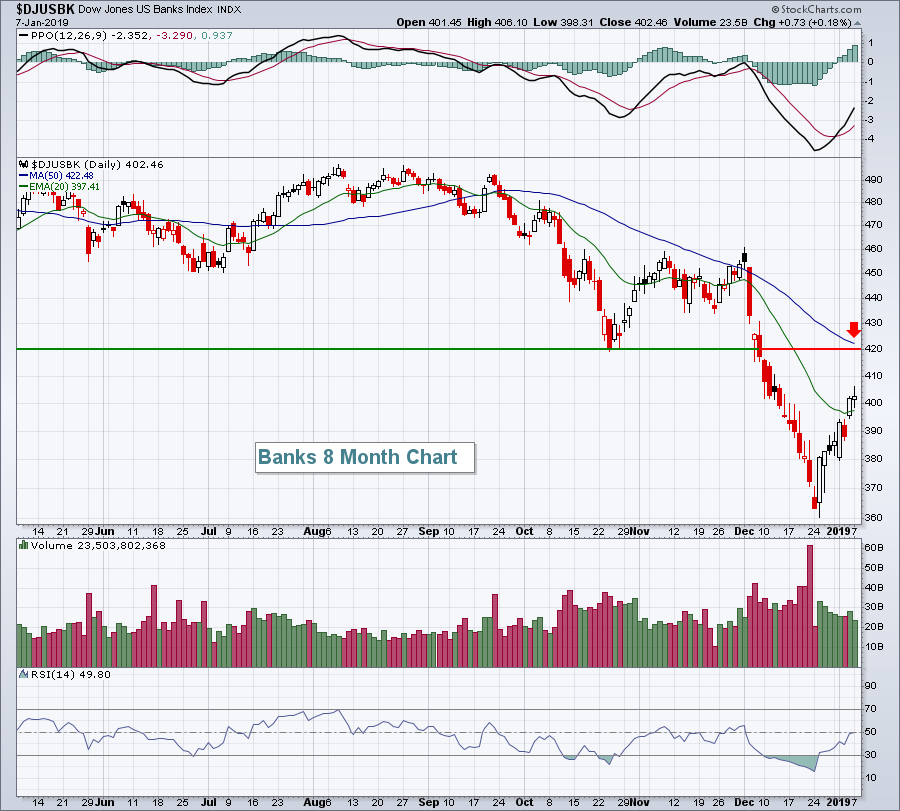 The DJUSBK broke above the 20 day EMA, so that moving average could be used as support to the downside. If the S&P 500 continues its recent ascent, look for further gains in banks to test overhead price resistance closer to 420, which likely will coincide with its declining 50 day SMA.
Specialty retail ($DJUSRS, +4.01%) was the strongest of the strong on Monday, but it can be argued that the DJUSRS has been one of the best performers throughout the recent volatility and declining market. Check this out:
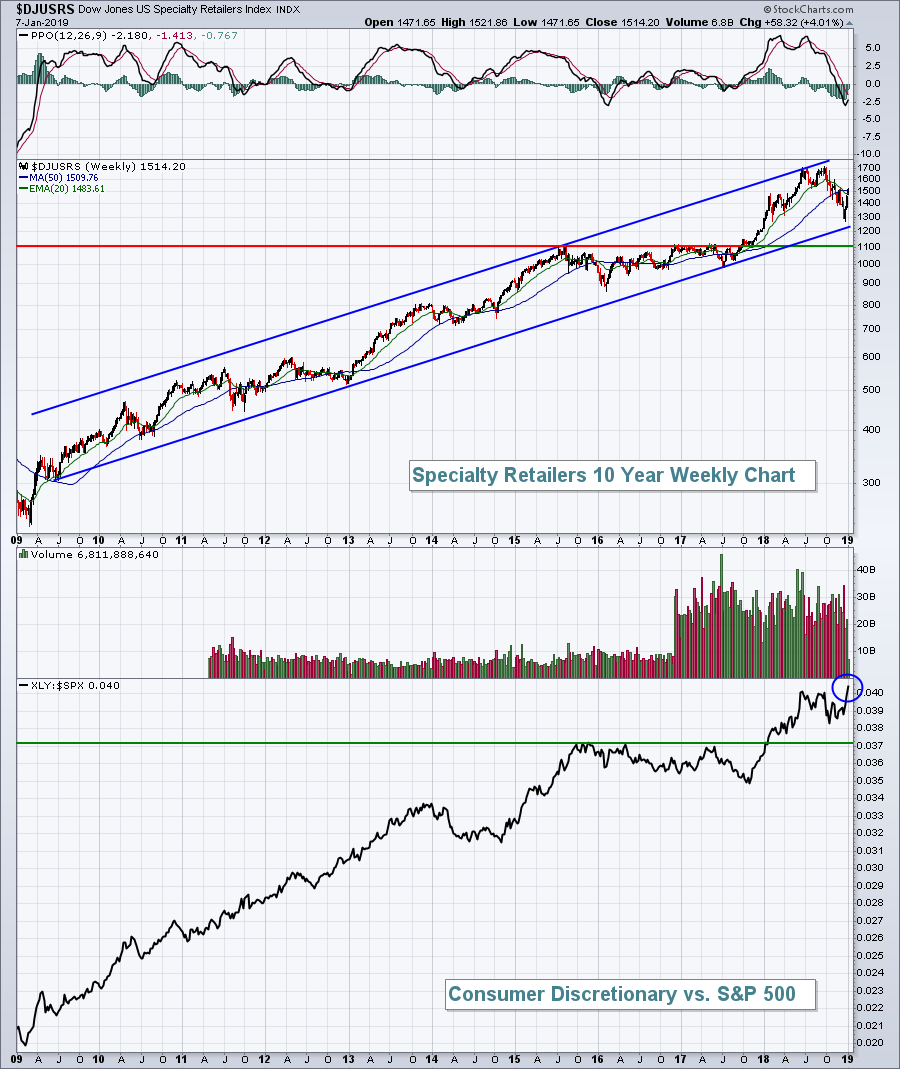 That's a very bullish up channel that was never broken during the Q4 selling. The trendline wasn't even tested. Furthermore, look at the bottom of the chart. Normally we see money rotating away from aggressive sectors during highly volatile price action. Instead, consumer discretionary (XLY) has broken out (blue circle above) relative to the S&P 500. Overall, consumer stocks are performing very well and the above chart highlights that strength.
Pre-Market Action
The U.S. Dollar Index ($USD) closed at a 2 month low on Monday, but is bouncing this morning. That's creating stiff headwinds for gold ($GOLD), which had been trending higher during the dollar's weakness. GOLD is down nearly $8 per ounce in early action. Crude oil ($WTIC) is back above $49 per barrel, up 1.5% at last check.
Asian markets were mixed last night as U.S.-China trade talks continue. There's obvious strength in Europe, however, with the German DAX ($DAX) higher by 132 points, or 1.23%, to 10880.
U.S. futures are reflecting more strength with Dow Jones futures higher by 201 points with nearly 40 minutes left to the opening bell.
Current Outlook
The biggest challenge our market faces in the near-term is overhead price resistance. We've rallied nicely off the late-December lows as expected, but moving higher from here should prove much more difficult. If you didn't read my December 27th article, "Support Has Been Established, Now How High Might We Bounce?", here was an excerpt:
"On this longer-term weekly chart, the S&P 500 bears will have multiple defenses. The obvious defense is price resistance. Previously, 2581 had marked closing price support on the daily chart and 2532 had marked intraday price support. So that range to the upside, 2532-2581, will provide key overhead resistance. The declining 20 week EMA is at 2690, but will be dropping rapidly. The combination of these three price levels will be most interesting to watch, along with VIX readings of course. I would expect another round of selling before the VIX ever drops below 20. That has been the history of early stage bear markets."
Below is an updated S&P 500 chart that I referred to in the above quote:
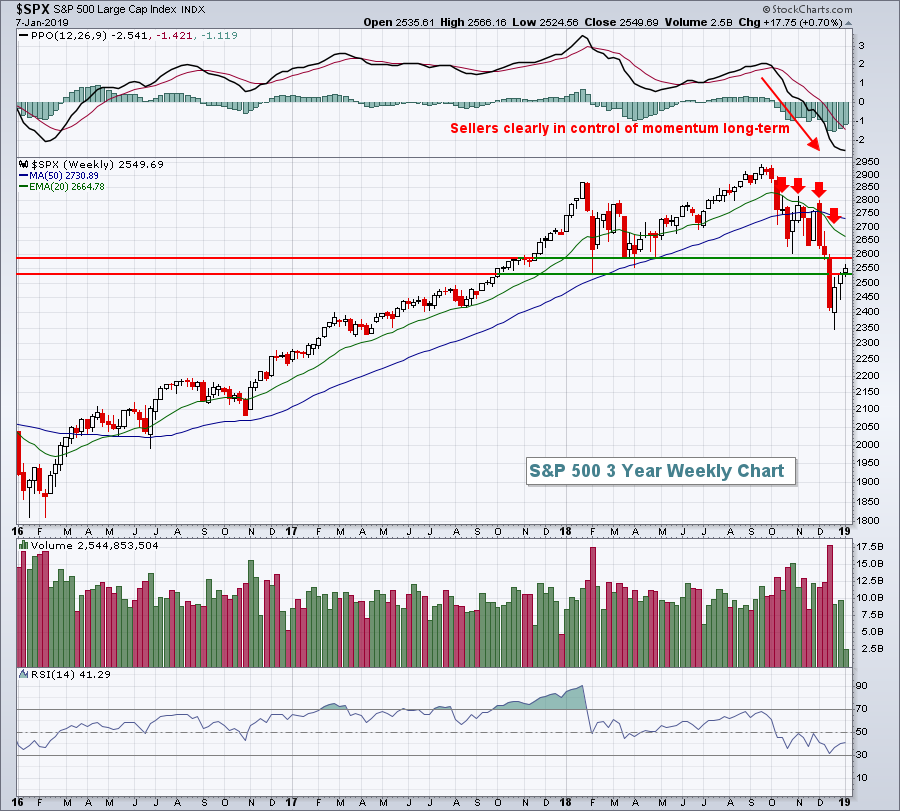 Those two resistance lines were drawn 100 points ago (on the S&P 500). Now that the bounce is in full swing, we must realize that there's now more downside risk to 2350, the recent low, than there is to the highest resistance level - the 20 week EMA, currently at 2665. 2581 will be an important price resistance level and 2582 is where we were sitting when Fed Chair Powell served up the latest FOMC policy statement. If you recall, the selling was rather intense after that announcement, so we shouldn't be too surprised if we find sellers there again.
Sector/Industry Watch
Let's look at the Volatility Index ($VIX) as this index is critical during emotional markets like the one we're witnessing. The VIX reading at 36 on December 24th warned us of an impending short-term bottom and it was correct once again. But now we've seen the VIX fall back to 21. Once the selling began in early-December, the VIX has not seen a close back below 20. The VIX is suggesting another bout of selling could arrive at any time:
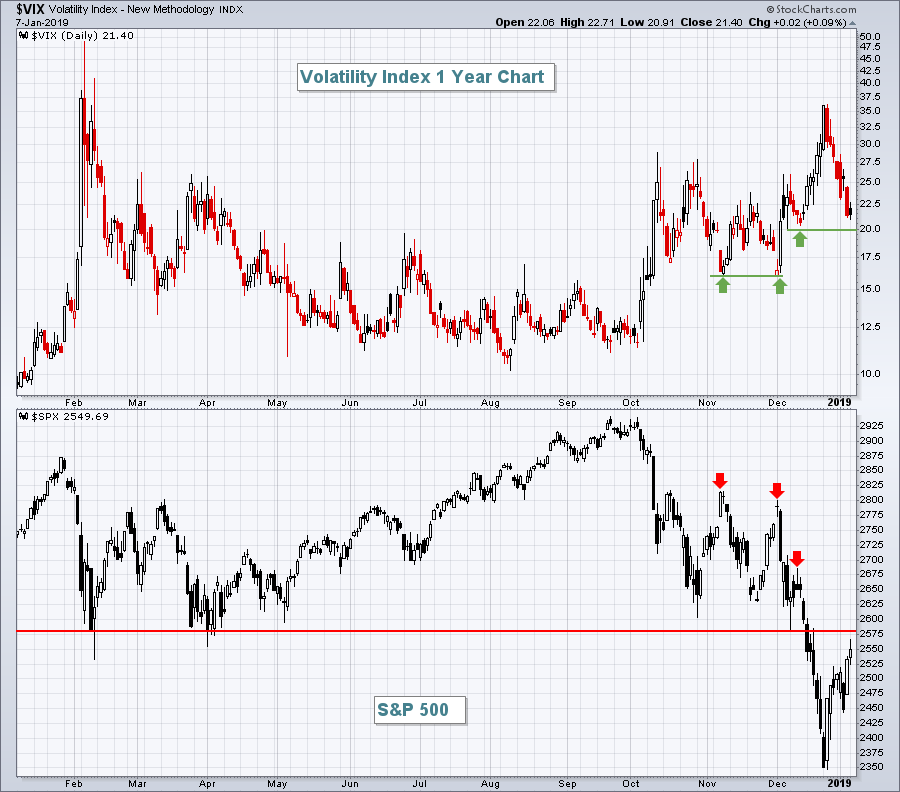 I'd definitely watch for a possible market reversal as the VIX nears 20. That should coincide with a price resistance test on the S&P 500 at 2581. Should the S&P 500 close above 2581 and the VIX close beneath 20, then the declining 20 week EMA would be my next target on the S&P 500.
Historical Tendencies
As discussed previously, the NASDAQ's best calendar month has been January since 1971. The NASDAQ has produced annualized returns of +31.72% during January over the past 48 years. January 2nd through 19th has been even stronger, however, producing annualized returns of +43.57% over the same period. So while technicals might suggest a drop is in store, historical tendencies would suggest otherwise.
Key Earnings Reports
(actual vs. estimate):
AZZ: .59 vs .61
HELE: 2.40 vs 2.40
LNN: .38 vs .47
Key Economic Reports
None
Happy trading!
Tom
