Market Recap for Thursday, January 24, 2019
Semiconductor stocks ($DJUSSC, +5.10%) soared after a few key earnings reports in the group came in better than expected. Xilinx (XLNX, +18.44%) and Lam Research (LRCX, +15.70%) were two of the best performers, but their results lifted much of the industry group, including Applied Materials (AMAT, +10.23%). The strength in the DJUSSC helped provide a lift to technology (XLK, +0.84%) as a whole. The XLK is now facing overhead trendline resistance and price resistance from 65.50-66.50:
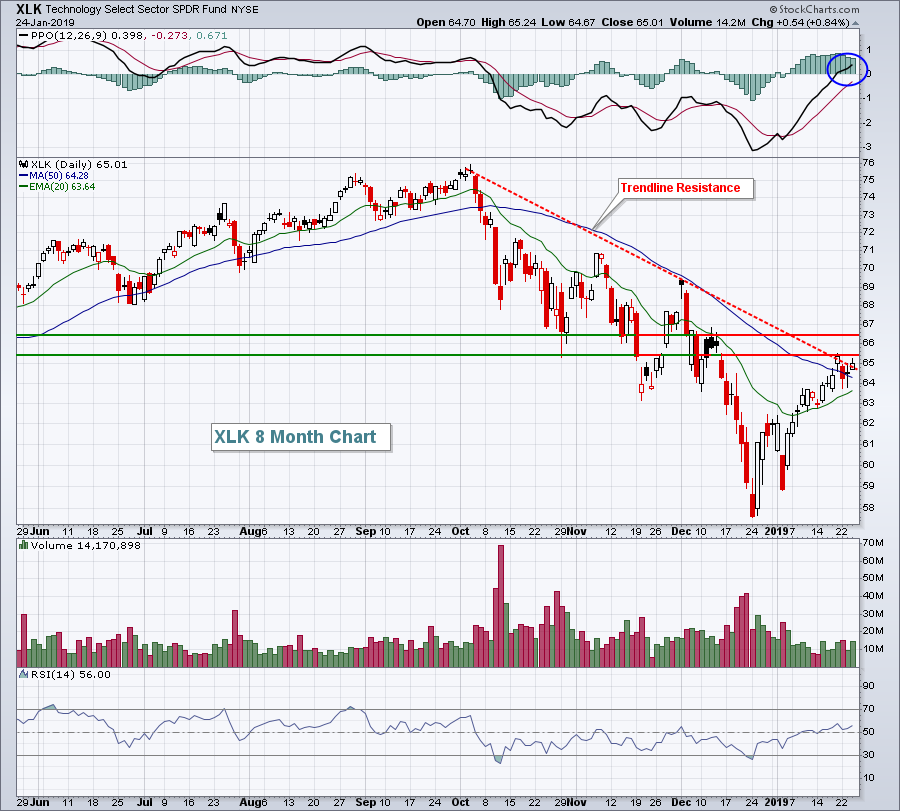 The volume hasn't been nearly as high on the push higher, which is bothersome to me, but as long as the XLK can continue to bounce off rising 20 day EMA support, I'm ok with the short-term outlook. Like so many other areas of the market, the longer-term picture is much cloudier and bearish. Therefore, if the short-term bullishness wanes, you'll want to approach the market with an abundance of caution.
Weakness on Thursday was found mostly in defensive stocks. Consumer staples (XLP, -1.24%) and healthcare (XLV, -0.84%) performed poorly as tobacco ($DJUSTB, -3.21%) and pharmas ($DJUSPR, -2.14%) were the primary culprits.
Pre-Market Action
Intel (INTC) reported dismal quarterly results after the bell last night, which could dampen the enthusiasm that we saw from semiconductor stocks on Thursday. Earnings this morning came up mostly short of EPS expectations as well. But the U.S. market appears to be focusing on what it hopes is the end of the government shutdown. That anticipation has Dow Jones futures higher by more than 100 points with 30 minutes left to the opening bell.
Current Outlook
Cyclical bear markets, which is what I believe we're experiencing, do not last nearly as long as the secular bear markets that we saw in 2000-2002 and 2007-2009. Our last two cyclical bear markets occurred in 1998 and 1990 and their charts can be seen below:
1998 Cyclical Bear Market:
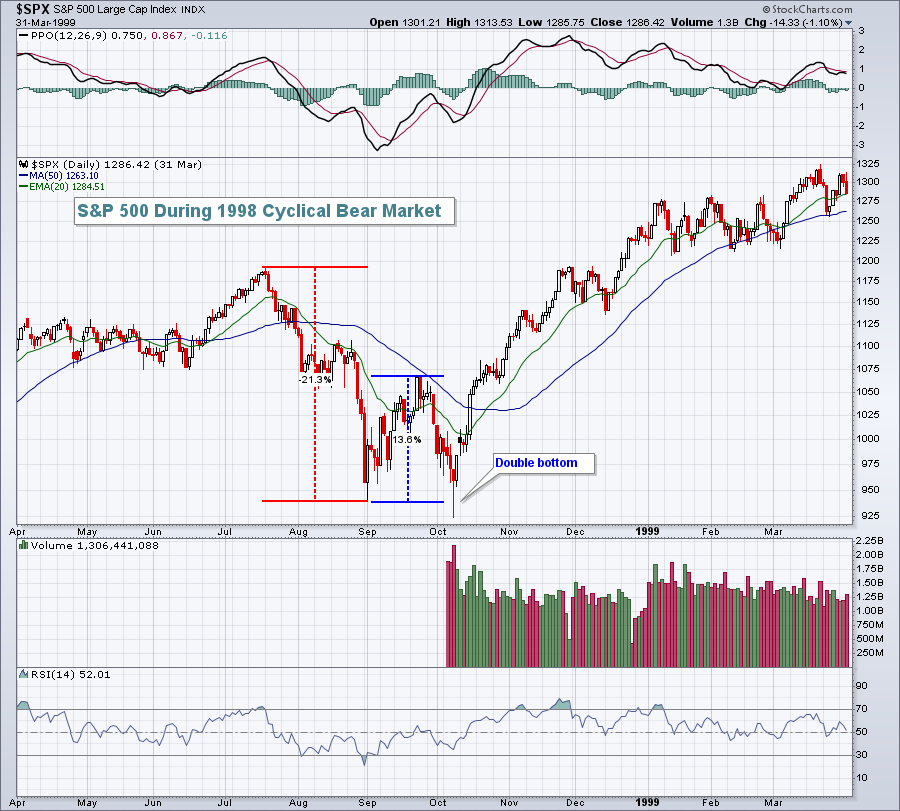 The initial drop was 21.3% and the subsequent bear market rally was 13.6% before the S&P 500 tumbled one more time to mark a double bottom. That set the major low as the bull market resumed until the secular bear market began in 2000.
1990 Cyclical Bear Market:
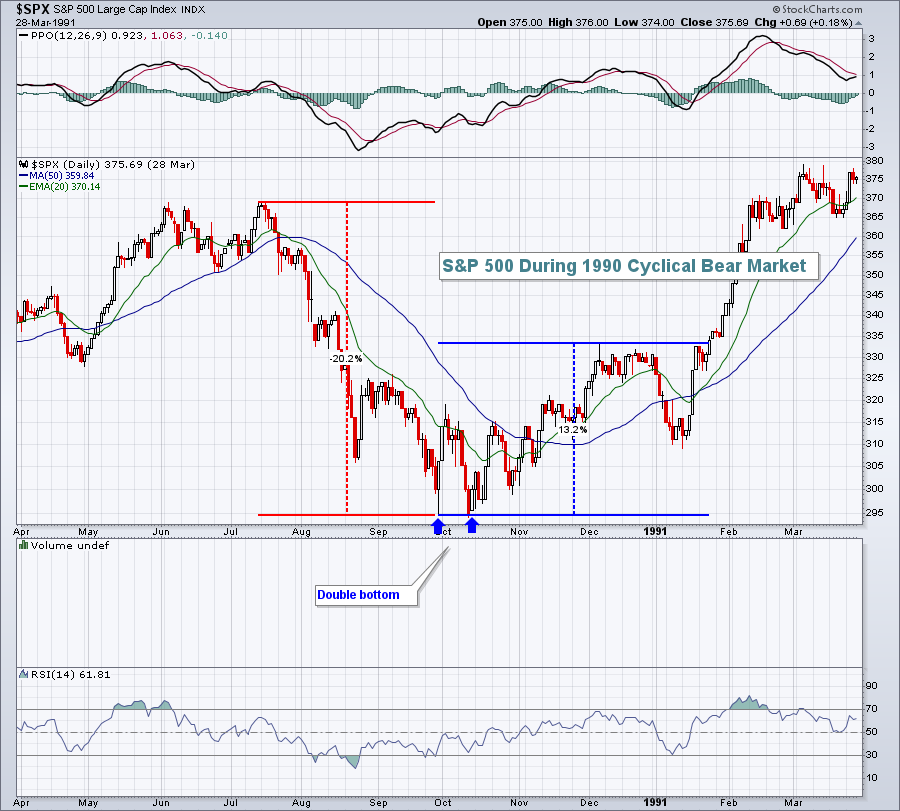 I see similarities. The initial drop was similar to 1998. The initial bear market rally was similar as well. Both cyclical bear markets saw retests of initial lows to set a bottom for the secular bull market to resume.
It's impossible to say how 2019 will unfold, but history suggests we don't have "V" bottoms like the one in place now. For comparison purposes, here's how the current cyclical bear market stacks up:
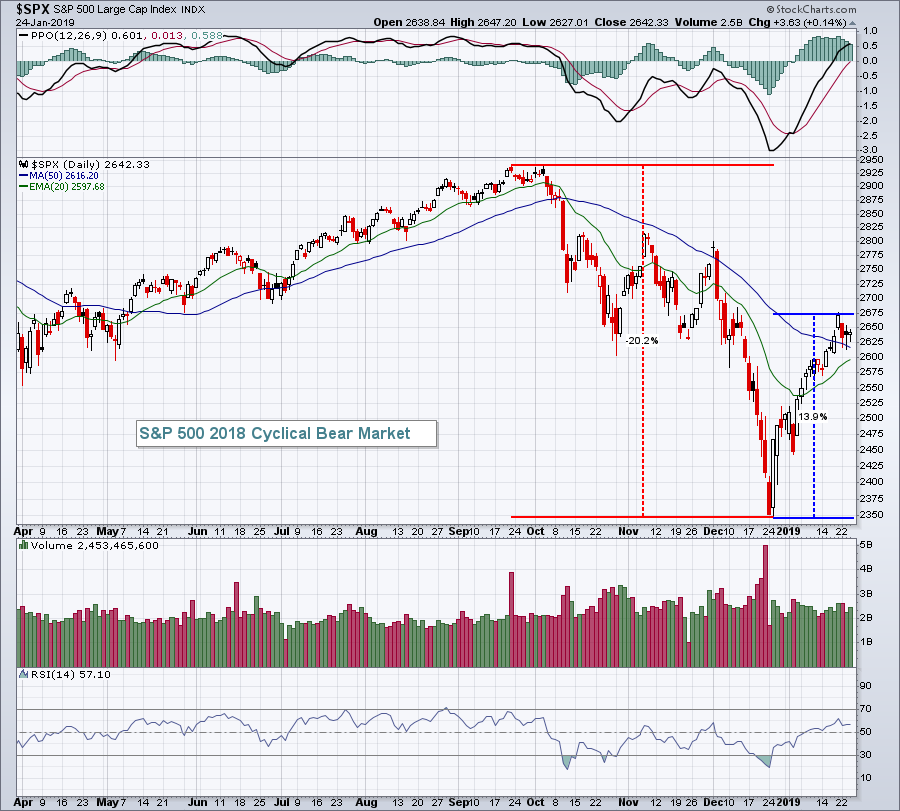 In both of the prior cyclical bear markets, the big warning sign was loss of the rising 20 day EMA. That's what I'd continue to watch.
Sector/Industry Watch
Let's keep an eye on treasuries. Yesterday, the 10 year treasury yield ($TNX) tumbled four basis points to 2.71%. It is rebounding this morning and is back to 2.74%. The 2.70%-2.80% now appears to be the battleground. A breakout to the upside will likely lead to further rotation away from treasuries, which is typically bullish for equities. But a drop in the TNX below 2.70% would indicate that traders are moving deeper into safety, historically a bearish development for stocks.
Historical Tendencies
Here are the historical returns and ranks for February:
S&P 500 (since 1950): +0.63% (ranks 9th out of 12 calendar months)
NASDAQ (since 1971): +7.81% (ranks 7th out of 12)
Russell 2000 (since 1987): +14.25% (ranks 6th out of 12)
Key Earnings Report
(actual vs. estimate):
ABBV: .90 vs .92
APD: 1.86 vs 1.87
CL: .74 vs .73
DHI: .76 vs .78
ERIC: (.09) vs .13
HRC: 1.02 vs .98
IBKC: 1.86 vs 1.78
LEA: 4.05 vs 3.96
NEE: 1.49 vs 1.51
Key Economic Report
December durable goods released at 8:30am EST: +1.8% (estimate - delayed due to govt. shutdown)
December durable goods released at 8:30am EST: +0.0% (estimate - delayed due to govt. shutdown)
December new home sales to be released at 10:00am EST: 569,000 (estimate)
Happy trading!
Tom
