Market Recap for Tuesday, February 12, 2019
Another government shutdown was averted and the U.S. stock market reacted quite favorably, as you might expect, with all of our major indices surging higher. Our major indices had quite a day:
Dow Jones: +1.49%
S&P 500: +1.29%
NASDAQ: +1.46%
Russell 2000: +1.27%
Materials (XLB, +2.24%) led all sectors, buoyed at least in part by a decline in the UUP (dollar proxy) for the first time in 9 days. Our aggressive sectors mostly led the way higher, though, as there was a "risk on" theme that permeated Wall Street. Industrials (XLI, +1.55%), consumer discretionary (XLY, +1.54%) and financials (XLF, +1.48%) all benefited by the renewed appetite for U.S. stocks. Among consumer discretionary areas, home construction ($DJUSHB, +5.25%) exploded to the upside, easily clearing double top resistance in January. The technical improvement in the DJUSHB is obvious:
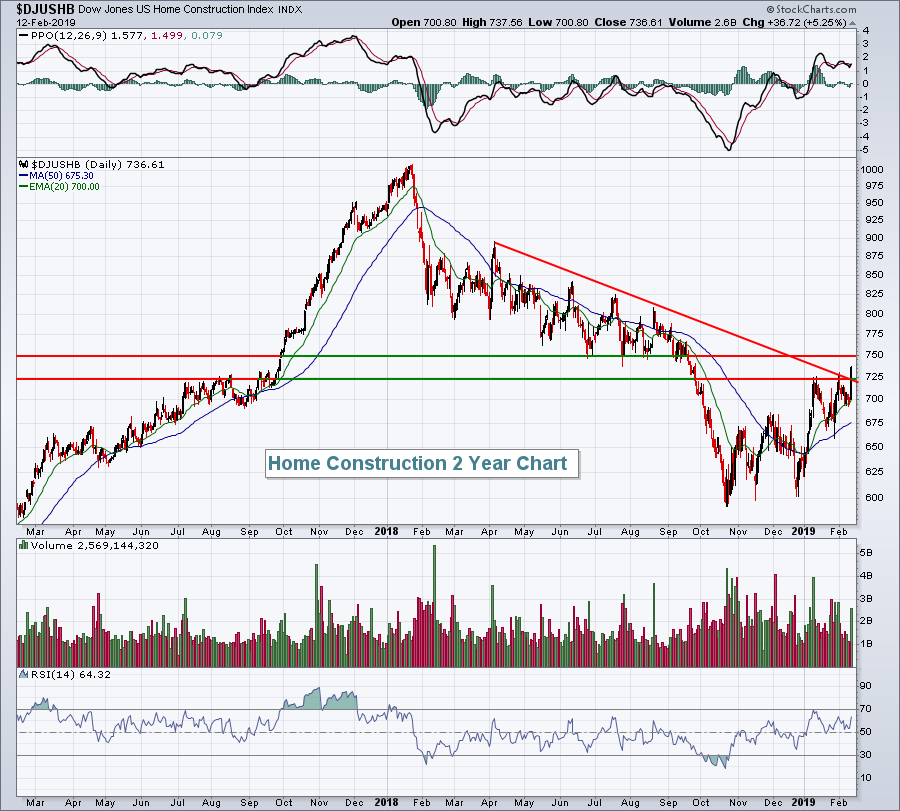 The DJUSHB saw accelerated selling in September when price support near 750 was lost. While yesterday's short-term breakout and 5% advance was encouraging, there'll be more technical obstacles ahead, the first of which will be price resistance at that 750 level.
The only sector to fail to participate in Tuesday's rally was real estate (XLRE, -0.69%), which was due for profit taking after its rapid ascent off the December low. Its PPO is looking tired and beginning to roll over so I'd expect further relative weakness here.
Among industry groups, brewers ($DJUSDB, -9.44%) were extremely weak after Molson Coors Brewing (TAP) reported its quarterly results that failed to meet expectations.
Pre-Market Action
The selling of U.S. treasuries appears to be picking up steam with the 10 year treasury yield ($TNX) up another 3 basis points this morning to 2.71%. Ultimately, stock traders will be watching the 2.80% level on the TNX. A break above that level would likely signal much more money rotating from bonds into stocks, helping to fuel a potential rally that could perhaps take U.S. stocks back to test all-time highs established during 2018.
Stocks in Asia were very strong overnight with most indices there gaining 1% or more on US-China trade optimism. President Trump also suggested that the March 1st deadline to levy tariffs if no deal was in place was flexible.
Here, stock futures are once again positive. Dow Jones futures are poised to rise close to 100 points as we approach the opening bell.
Current Outlook
I love the way that the consumer discretionary (XLY) area is setting up. The XLY was a stellar performer in 2018 and held up relatively well during the Q4 stock market meltdown. I suspect we'll be breaking out to new absolute and relative highs in 2019 as I believe we remain firmly entrenched in a secular bull market that will last for several more years, despite the recent chaos associated with the Q4 cyclical bear market. The XLY has been a great investment relative to the benchmark S&P 500 since the major market bottom in 2009 and it looks to be setting up for more relative strength ahead:
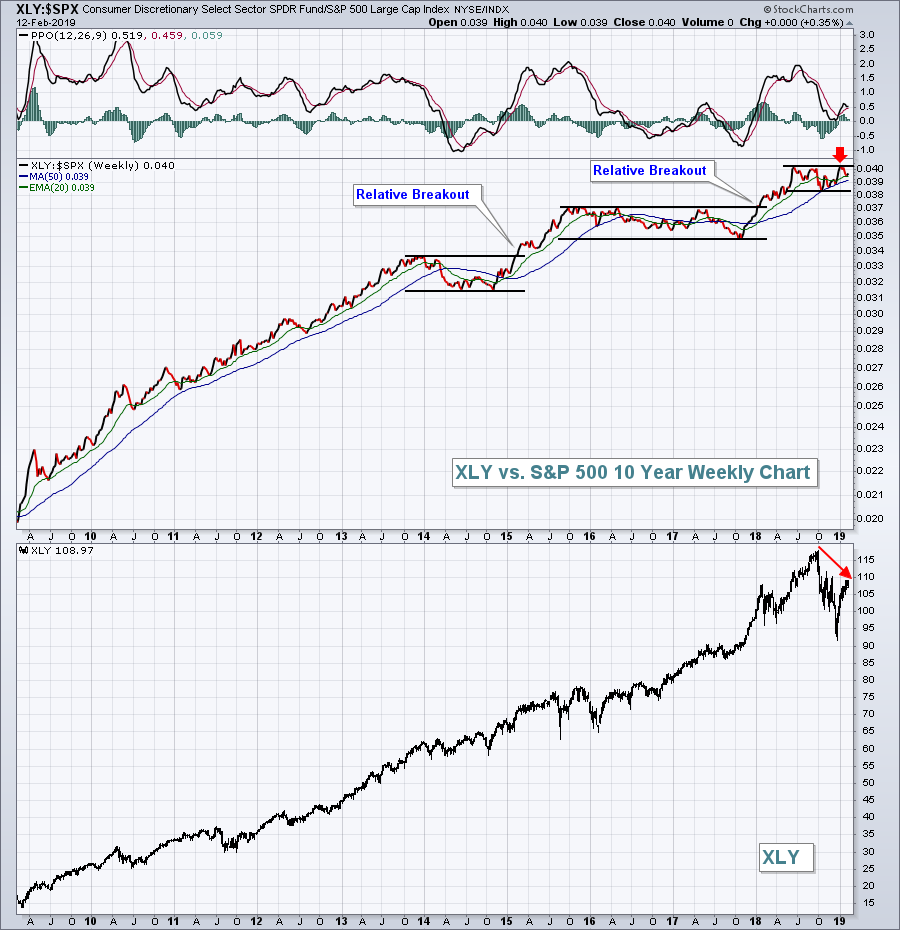 A relative breakout (red arrow) will be your clue that you want to overweight the XLY and/or stocks within this industry.
***Please subscribe to my blog at the bottom of this article, if you haven't already. It's one confirmation that you enjoy my daily blog articles. It's free, you won't be spammed, and you'll receive my articles each morning directly to the email address provided. Simply scroll down, enter your email address in the space provided and click the green "Subscribe" button. Voila! Your support is much appreciated always. :-)
Sector/Industry Watch
The Current Outlook section showed that consumer discretionary's relative strength is important to consider in your trading and/or investing strategy. Let's take this one step further and look "under the hood" of the discretionary sector to find a strengthening industry group:
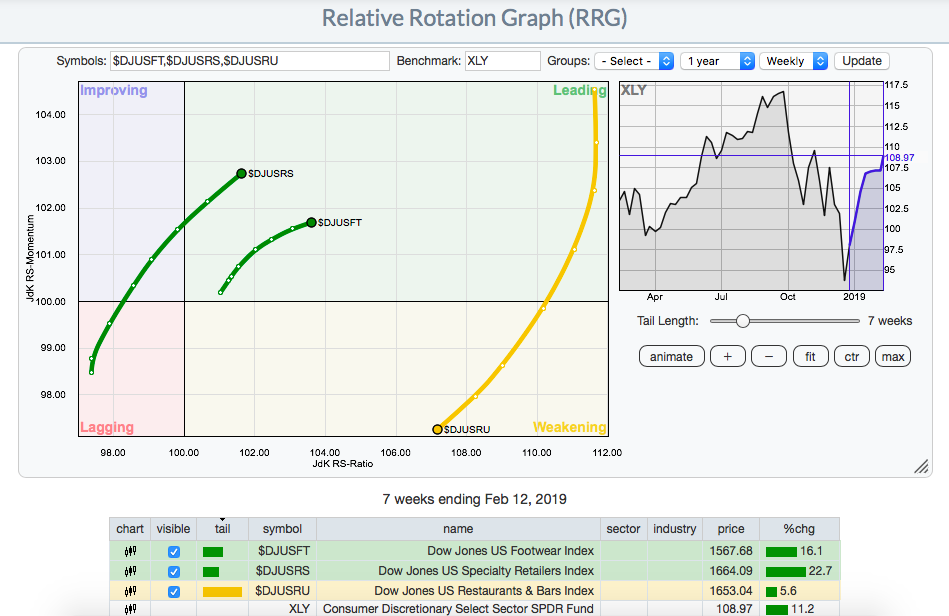 When using the RRG charts, you need to understand what the horizontal and vertical lines represent. The horizontal line highlights relative strength with the XLY as the benchmark, while the vertical line measures relative momentum. At first glance, the restaurant & bars ($DJUSRU) area looks weak as its fallen substantially on a relative basis the past 7 weeks. But look how far to the right and how high it was 7 weeks ago! The DJUSRU had been one of the best, if not THE best, industry group in the stock market during the Q4 massacre. Every group is entitled to some profit taking. As you can see from the numbers beneath the RRG chart, the DJUSRU has gained 5.6% over the past 7 weeks. So it's rising, it's simply taking a relative break from its massive relative outperformance. I expect we'll see a return of DJUSRU to the leading quadrant in time.
But my focus on the above chart is specialty retailers ($DJUSRS). What a relative move during the stock market's reversal since the December low! The group is on fire and easily outperforming. It's gained 22.7% over the past 7 weeks, more than double its peers in the consumer discretionary sector (XLY). If I want to achieve my goal of beating the S&P 500, I need to own stocks within groups that are strong relative performers.
One stock that I currently own (and looking to add more on weakness) is 1-800 FLOWERS (FLWS), which not only loves the Spring season historically, but recently broke out on quarterly results that easily topped Wall Street expectations. Here's the chart:
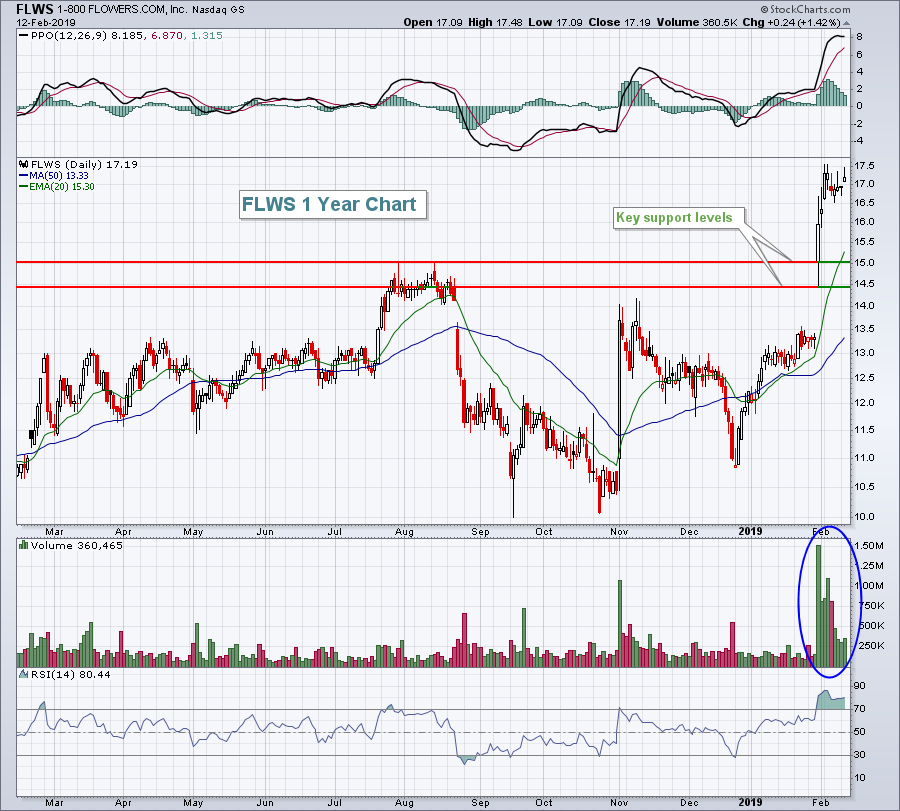 The heavy volume suggests potential institutional accumulation, which is always a bullish development. Yes, FLWS is overbought near-term, but weakness will likely attract more buyers. I believe the downside is limited to the support levels identified above. I expect FLWS to help me achieve my goal of outperforming the S&P 500. Time will tell.
If you'd like to learn more about RRG analysis, you're at the right place here at StockCharts.com. Julius de Kempenaer, a great friend and fellow blogger, is the creator of RRG charts and posts regularly to his blog, "RRG Charts". I'd recommend you visit Julius' blog often and even subscribe at the bottom of his articles to learn more about this fascinating way to view the U.S. stock market (and other markets and asset classes).
Also, yesterday on MarketWatchers LIVE, I did a "Break It Down" segment, focusing on consumer discretionary and subgroups like footwear, restaurants & bars, and specialty retailers. You can CLICK HERE to watch the show. It started roughly at the 37:30 minute mark of the video. Check it out!
Historical Tendencies
Retail stocks (XRT) love February, March, and April, where the XRT has averaged gaining 2.4%, 3.9% and 2.7%, respectively, over the past 20 years. The XRT averages gaining 10.5% per year and averages gaining 9.0% in just the February through April period. Clearly, we're in a sweet spot for retail stocks. Specialty retailers ($DJUSRS), highlighted as a strengthening industry group in the Sector/Industry Watch section above using RRG analysis, also shows seasonal strength as we approach Spring:
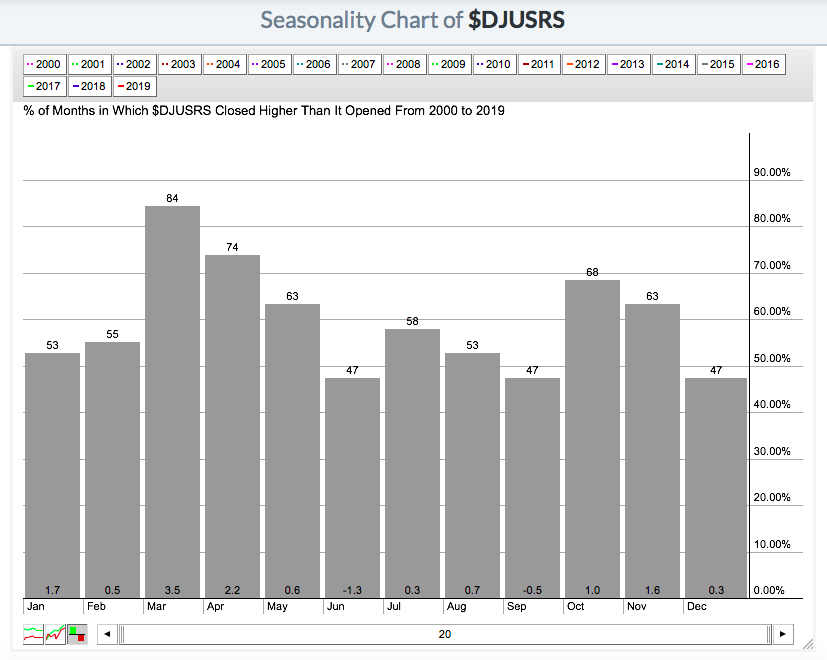 I don't use seasonality as my primary decision-making tool here at StockCharts.com, but I love to see seasonal patterns confirm a technical outlook.
Key Earnings Reports
(actual vs. estimate):
CBRE: 1.21 vs 1.13
DISH: .64 vs .67
GPN: 1.33 vs 1.32
HLT: .79 vs .69
IPG: .89 vs .81
TECK: .65 vs .81
TEVA: .53 vs .56
(reports after close, estimate provided):
AIG: .47
CF: .51
CSCO: .72
CTL: .36
DVA: .89
EQIX: 4.92
HCP: .43
IFF: 1.29
MFC: .50
MGM: .13
MRO: .13
NLY: .28
NTAP: 1.15
PXD: 1.48
REG: .94
SLF: .87
WCN: .61
WMB: .22
Key Economic Reports
January CPI released at 8:30am EST: +0.0% (actual) vs. +0.1% (estimate)
January Core CPI released at 8:30am EST: +0.1% (actual) vs. +0.2% (estimate)
Happy trading!
Tom
