Market Recap for Thursday, February 7, 2019
The bears have been waiting for a day like yesterday, which featured a bit of impulsive selling and an accelerating Volatility Index ($VIX). Unfortunately, the bulls may have already inflicted too much damage upon the bears for them to recover fully. I view this nothing more than an overbought pullback for now. I have a short-term "line in the sand" for the S&P 500. Until that is lost, I'm viewing this as normal profit taking.
All of our major indices declined, led by the NASDAQ's 1.18% drop. Energy (XLE, -2.21%) was the weak link as crude oil prices ($WTIC, -2.53%) fell beneath their 20 day EMA for the first time since climbing above that moving average on January 7th. It's also not helping that the U.S. Dollar Index ($USD) rose for the 6th consecutive session as a rising dollar provides headwinds for energy and materials (XLB, -1.38%):
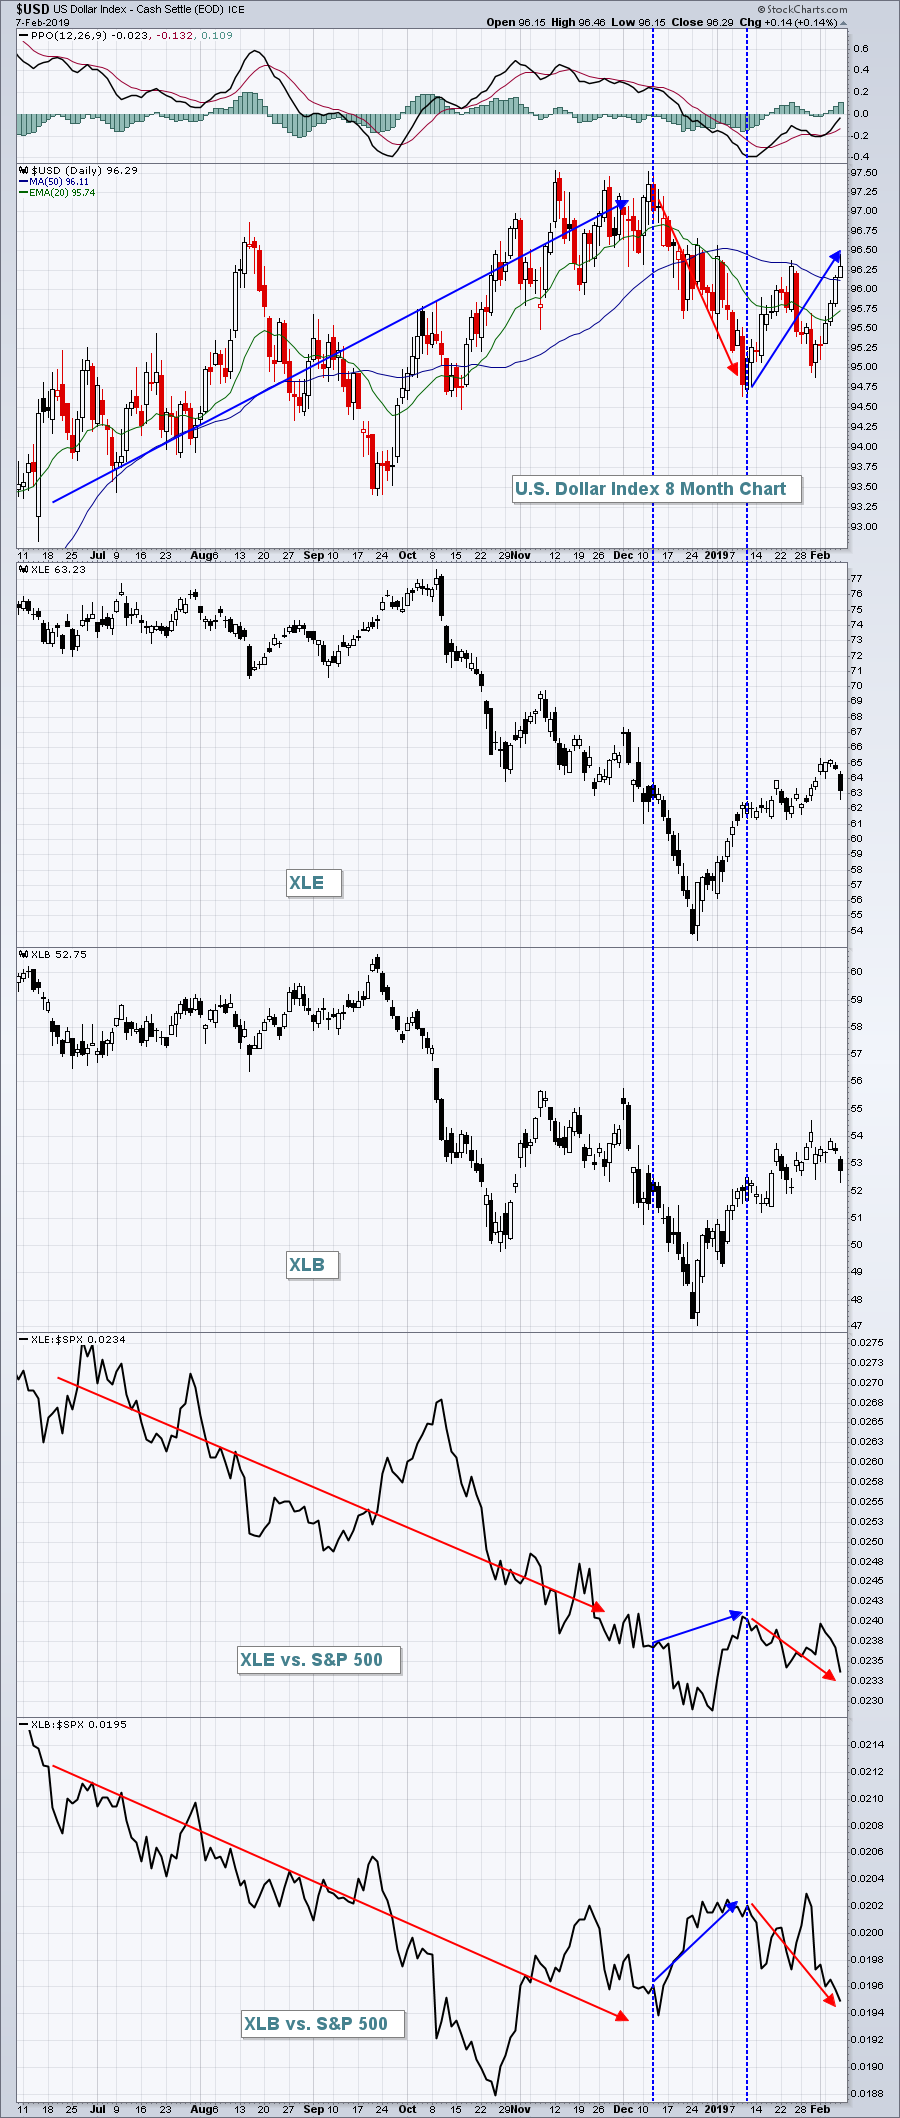 The above chart illustrates perfectly the relationship between the dollar's direction and the relative strength of energy (XLE) and materials (XLB) vs. the benchmark S&P 500. It is much more likely to see outperformance from the XLE and XLB if we see a deteriorating dollar. If the 10 year treasury yield ($TNX) continues to slide lower, the odds are that this dollar rally won't last. More on that in the Sector/Industry Watch section below.
Leading the market on Thursday were exactly the sectors you'd expect to lead on a rough market day - defensive groups. Utilities (XLU, +1.32%) and real estate (XLRE, +0.85%) were the only sectors to finish in positive territory.
Pre-Market Action
Futures look to extend weakness that we saw on Thursday as Dow Jones futures are down roughly 100 points with 30 minutes left to the opening bell.
The 10 year treasury yield ($TNX) is down another basis point to 2.64%, a continuing warning signal from the treasury market. Crude oil ($WTIC) is down fractionally while gold ($GOLD) is up $4 per ounce to $1318.
Current Outlook
One technical problem that developed over the past couple trading sessions is that most of our key indices have produced higher prices, but their respective PPOs have not responded accordingly. That is the definition of a negative divergence, which suggests slowing price momentum. Let's check out the S&P 500's hourly chart:
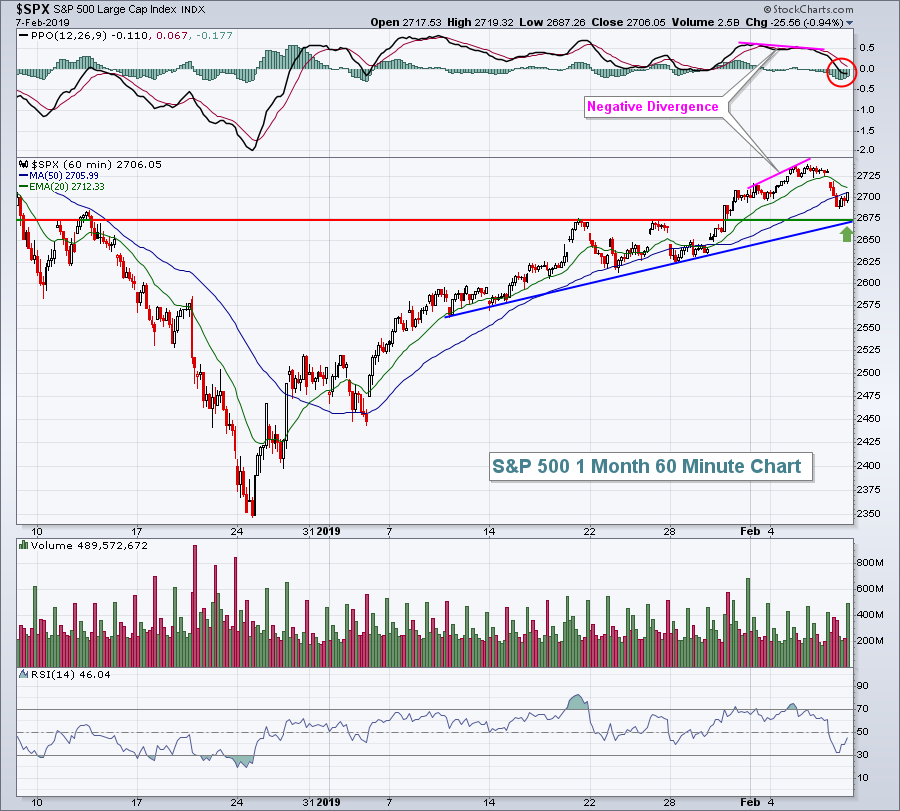 The negative divergence suggested a potential 50 day SMA test and PPO centerline "reset" (red circle). We've seen both. 2674 is a critical short-term support level as it represents both price support and trendline support (green arrow). A break of both with the hourly PPO in negative territory should at least give the bulls reason to pause. It should be noted that the 20 week EMA (not shown above) currently resides at 2675. The candlestick on the weekly chart goes final today as Friday marks the end of the week. Should the S&P 500 lose the above 2674 support level on the close, it will also be a near-term breakdown on the weekly chart as well. One other key support level slightly beneath 2674 is the 20 day EMA, which is at 2663. Loss of that level would create a breakdown on the daily chart to accompany both the hourly and weekly breakdowns. We've seen a tremendous rally and I don't want to grow overly pessimistic if the S&P 500 pulls back 2-3% as that should be considered normal profit taking off of overbought conditions. But given the backdrop of that December decline, a move below all of these different support levels could provide the bears much more ammunition for a further selloff.
Sector/Industry Watch
Will the U.S. Dollar ($USD) continue its recent winning streak to move higher? And, if so, will that result in underperformance by energy (XLE) and materials (XLB)? The clue most likely lies with the treasury market. When U.S. treasury yields move up faster than foreign treasury yields, particularly Germany's, the USD normally rises with it as it signals that the U.S. economy is performing better than foreign economies. Here's the latest chart of this relationship:
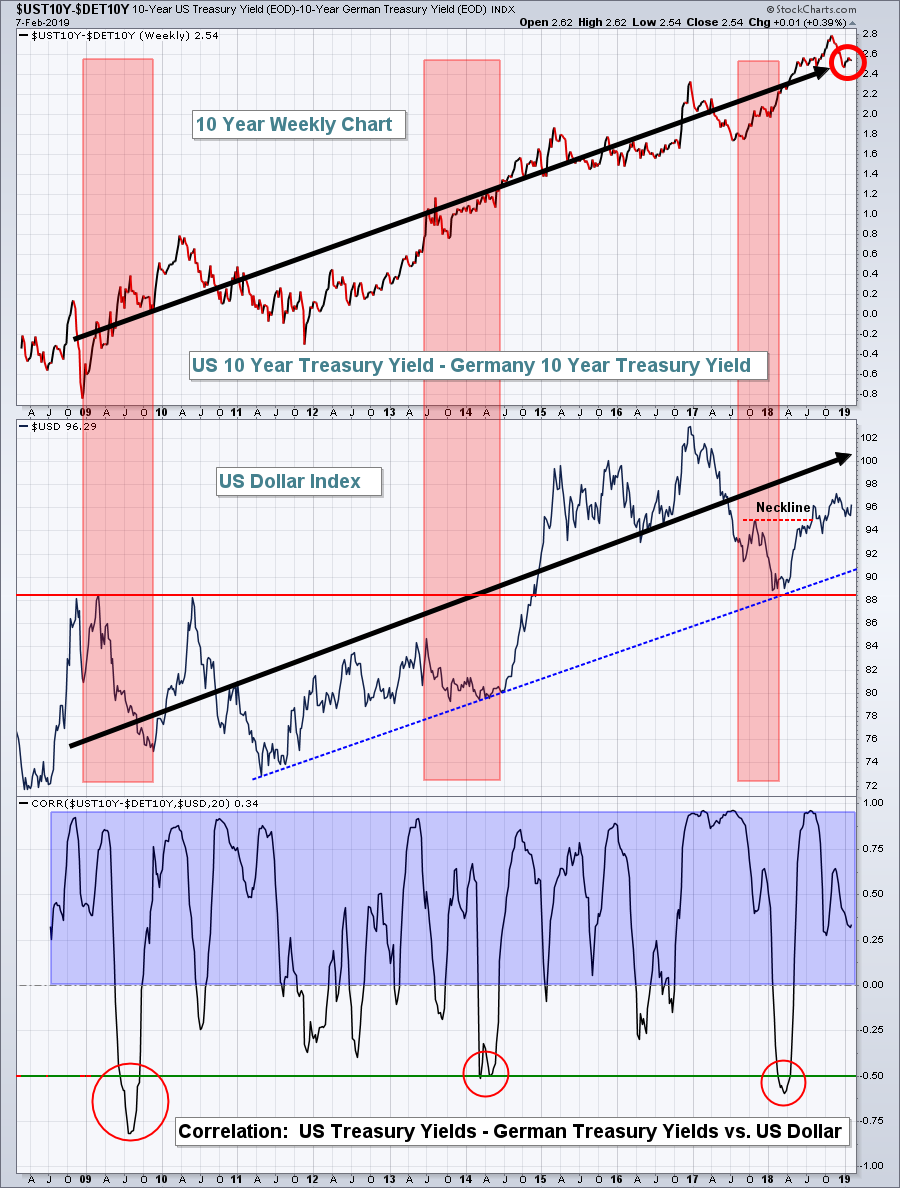 The USD has been in an uptrend ever since the S&P 500 bottomed in 2009. Our economy has performed better than Germany's, resulting in a more rapidly increasing treasury yield. The dark red circle at the upper right hand portion of the chart shows that after a temporary decline, U.S. treasury yields are beginning to rise faster than Germany's once again.....and we've seen the dollar's renewed ascent as a result. Watch this relationship. While our treasury yields have come under fire of late, they haven't been hit as hard as Germany's treasury yields and that's what is highlighted on the above chart.
Historical Tendencies
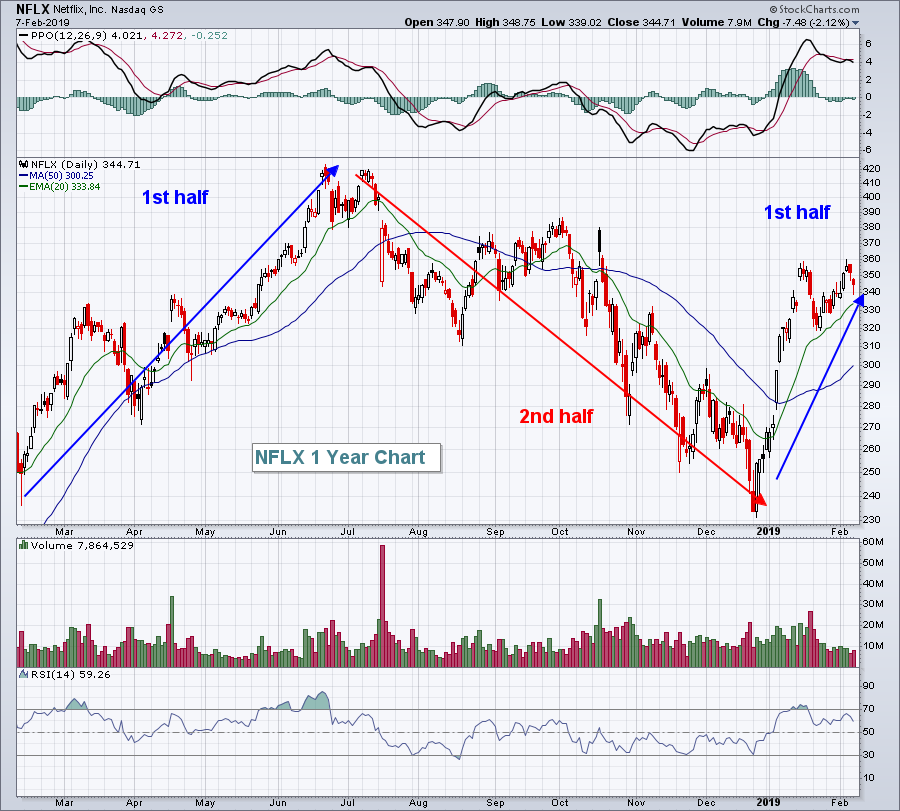
I've discussed the tremendous bullish history of Booking Holdings (BKNG) in the first half of the calendar year. Of all the S&P 500 companies, it has the widest disparity in performance between the first half of the year and the second half of the year (41 percentage points). The second best in this category? Netflix (NFLX). Its first half outperforms its second half by 23 percentage points. Knowing that, check out this chart:
 Interesting?
Key Earnings Reports
(actual vs. estimate):
ARNC: .33 vs .30
CBOE: 1.54 vs 1.35
COTY: .24 vs .22
EEFT: 1.37 vs 1.27
EXC: .58 vs .58
GT: .51 vs .60
HAS: 1.33 vs 1.68
PSX: 4.87 vs 2.76
VTR: .96 vs .95
Key Economic Reports
None
Happy trading!
Tom
