Market Recap for Thursday, March 7, 2019
Selling in U.S. equities continued for a fourth consecutive session as this is easily the most difficult period in 2019 for the equity bulls. The first technical breakdown occurred on daily charts as all of our major indices closed beneath their respective 20 day EMAs. Short-term technical health will not return until the bulls are able to reclaim this key moving average. Here's the S&P 500 chart:
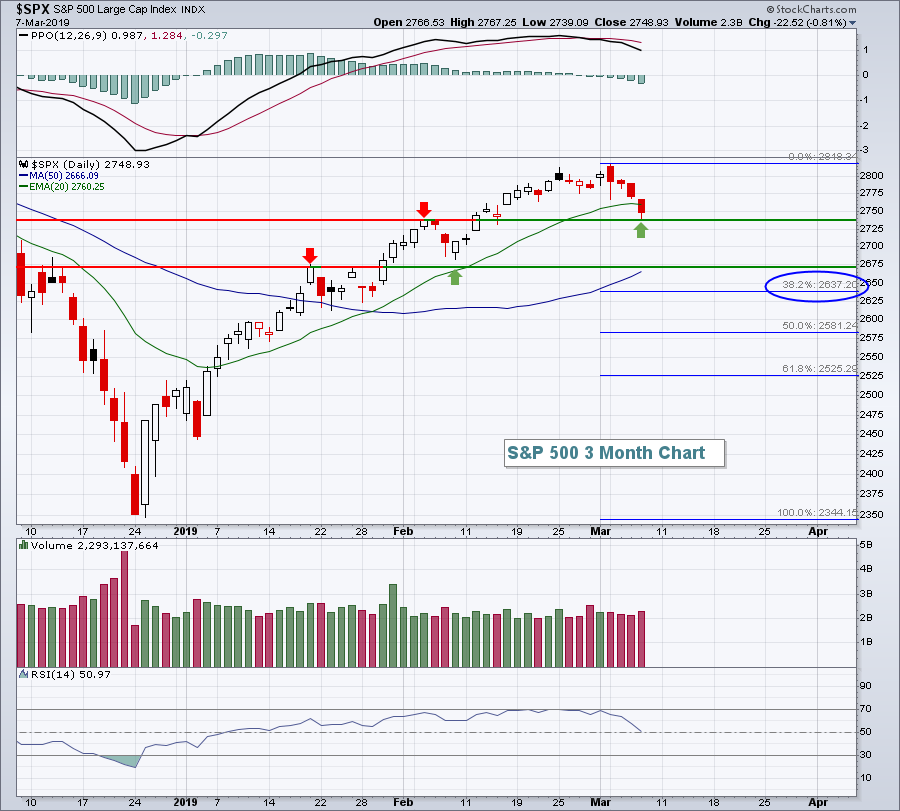 After losing 20 day EMA support, a couple upcoming support levels should be monitored. We are likely going to gap beneath initial price support at the 2740 area. The initial Fibonacci 38.2% retracement level is 2637, while the next significant price support is closer to 2670. Barring a big reversal today, I'd expect one or both of these levels to be tested.
I recently posted that the aggressive sectors had been leading the market higher, which is generally a very bullish development. Over the past three sessions, these sectors had held up fairly well on a relative basis, but that changed yesterday as consumer discretionary (XLY, -1.21%), financials (XLF, -1.03%), technology (XLK, -0.95%) and communication services (XLC, -0.88%) were all on the bottom of the sector leaderboard.
Home construction ($DJUSHB, +3.06%) was really the lone bright spot in consumer discretionary, but it was not nearly enough to carry the group.
Pre-Market Action
There's not much bullishness to point to this morning. Asian markets, especially the China Shanghai Composite ($SSEC, -4.40%), were very weak overnight. European markets are also quite weak this morning. Global weakness, combined with a poor jobs report, has led Dow Jones futures much lower, down more than 200 points with 30 minutes left to the opening bell.
February nonfarm payrolls produced just 20,000 jobs, well below the consensus estimate of 175,000. While the unemployment rate dipped to 3.8% and average hourly earnings rose 0.4%, two positives, the shortfall in jobs is likely to weigh on U.S. equities today.
Bears have been on the defensive for weeks, but that has changed. Momentum is now clearly lower, so we'll need to grow a bit more cautious until the bulls show they can hold key support levels.
Current Outlook
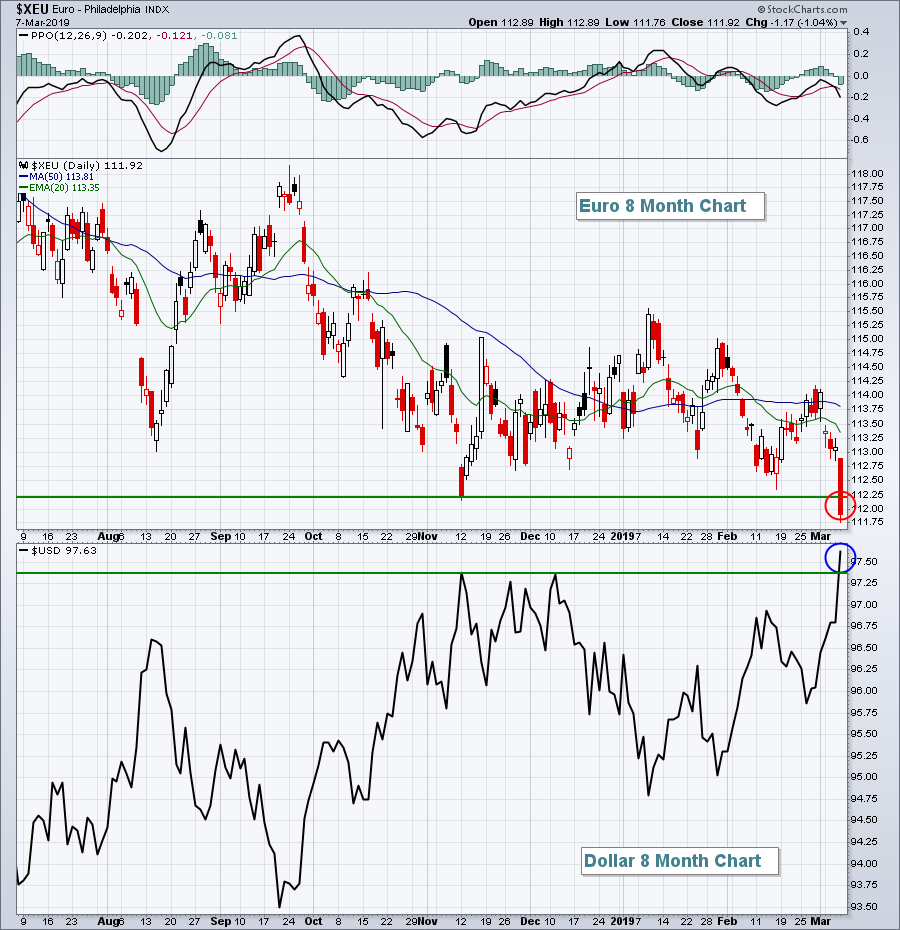
After the European Central Bank (ECB) decided to deliver another round of quantitate easing (QE) to European nations in the form of cheap bank loans, one of the biggest responses came in the form of currency moves. In the following chart, you can see the euro ($XEU) breaking down and the dollar ($USD) breaking out:
 This development is particularly bearish for energy (XLE) and materials (XLB) as it signals more of what we've seen for 8 years - relative weakness. Need a picture?
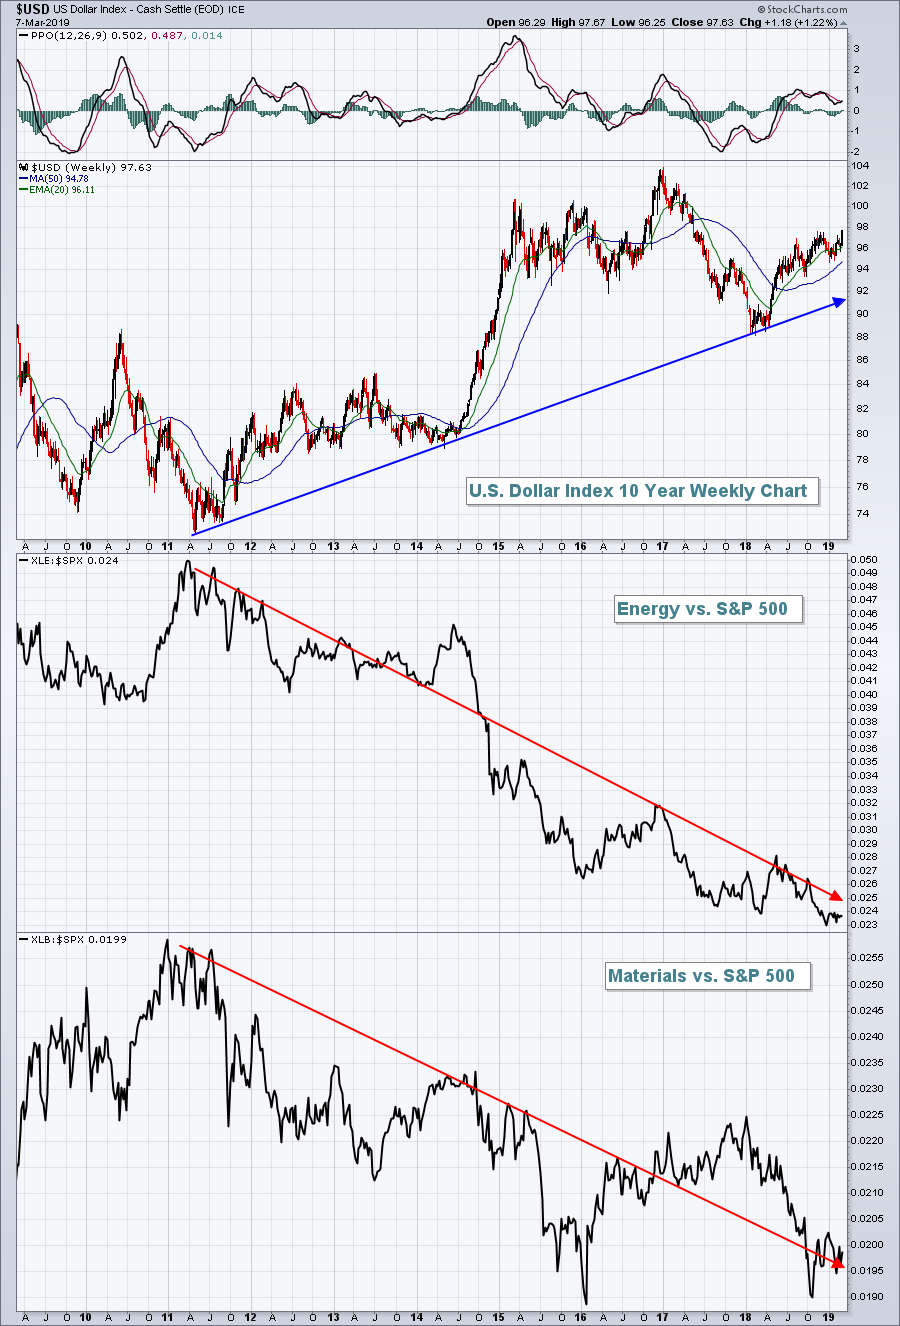 While the USD's breakout wasn't above the 2016 high, it clearly broke out above the congestion in Q4 2018. Furthermore, the uptrend established in 2011 remains in play. That uptrend has proven difficult for energy and materials as both sectors have lagged the S&P 500 badly since 2011.
Sector/Industry Watch
The Dow Jones U.S. Apparel Retailers Index ($DJUSRA) was able to climb above both its December reaction high and its 20 week EMA during the 2019 market rally. We'll want to watch to see if the DJUSRA can hold 20 week EMA support on any decline. Ross Stores (ROST), meanwhile, has been one of the top performing apparel retailers for many years and it continues to outperform, as illustrated in the chart below:
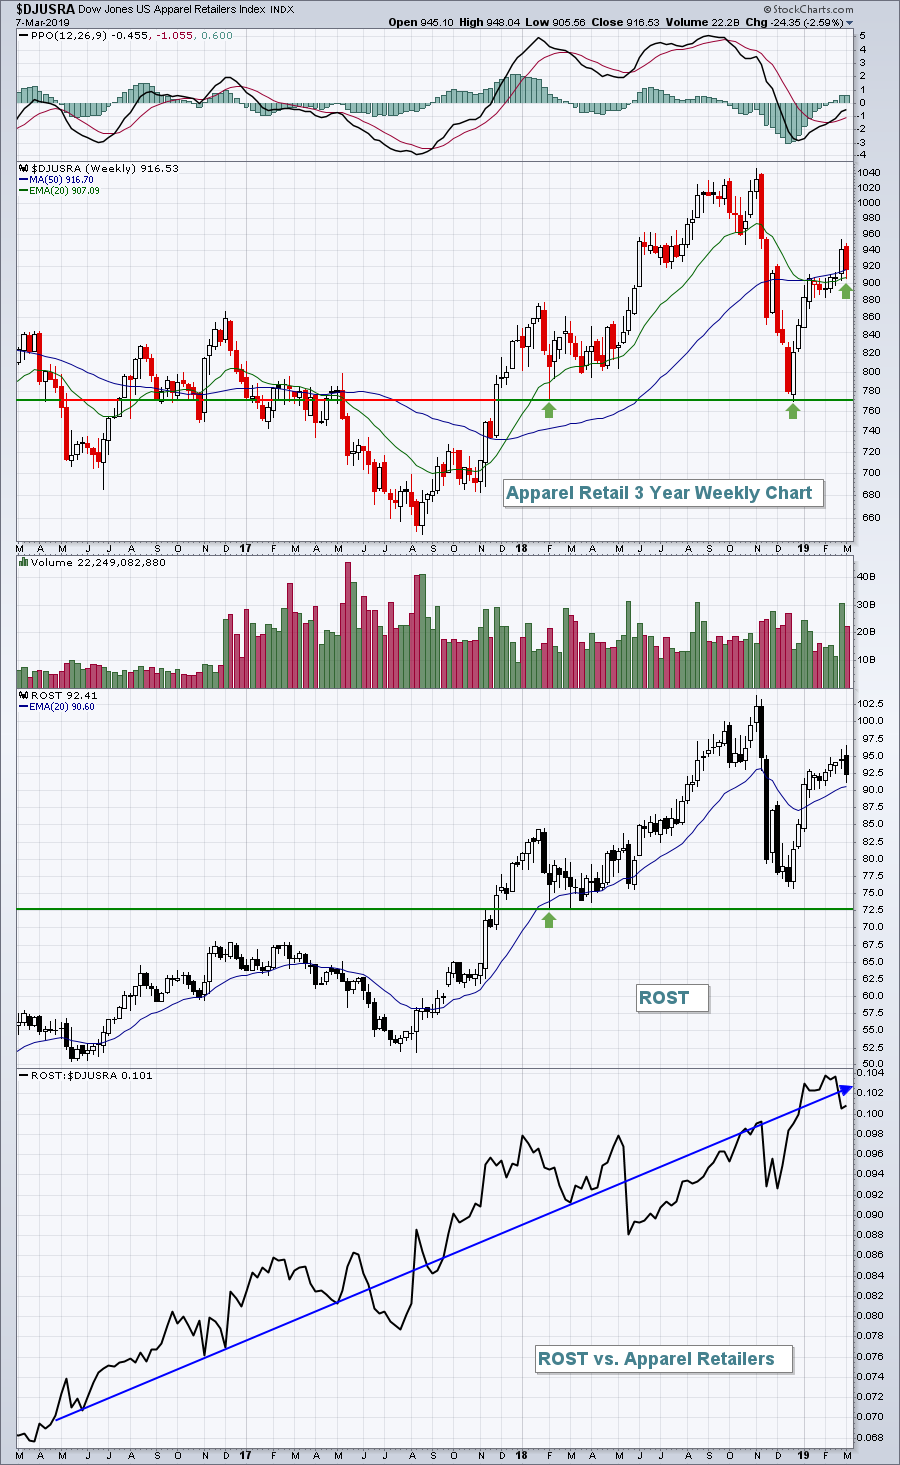 If the DJUSRA loses its 20 week EMA support, longer-term price support is at that double bottom from February/December 2018 near 770.
Historical Tendencies
Ross Stores (ROST) has been a great performing component in the NASDAQ 100 for a long time. It's pulled back somewhat since reporting its latest quarterly results and could present an opportunity given its history of performing well this time of year:
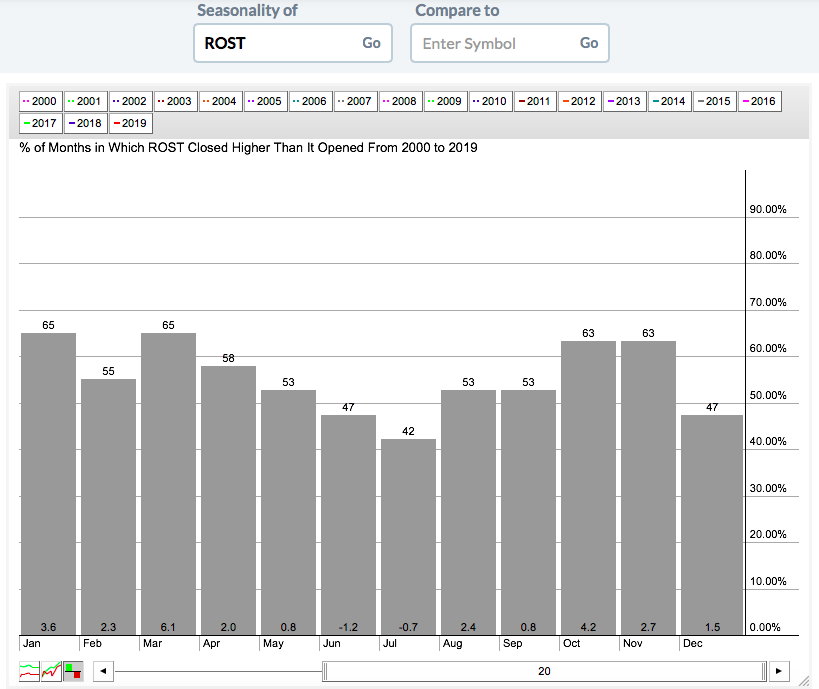 ROST has produced average gains of 6.1% in March over the past two decades. From the above, you can see that only June and July have produced negative average monthly returns. ROST has been a solid long-term performer.
Key Earnings Reports
(actual vs. estimate):
MTN: 5.02 vs 4.92
Key Economic Reports
February nonfarm payrolls released at 8:30am EST: 20,000 (actual) vs. 175,000 (estimate)
February private payrolls released at 8:30am EST: 25,000 (actual) vs. 170,000 (estimate)
February unemployment rate released at 8:30am EST: 3.8% (actual) vs. 3.9% (estimate)
February average hourly earnings released at 8:30am EST: +0.4% (actual) vs. +0.3% (estimate)
January housing starts released at 8:30am EST: 1,230,000 (actual) vs. 1,170,000 (estimate)
January building permits released at 8:30am EST: 1,345,000 (actual) vs. 1,287,000 (estimate)
Happy trading!
Tom
