Market Recap for Thursday, February 28, 2019
Our major indices were lower across the board on Thursday, but losses were minimal. The Dow Jones, S&P 500, NASDAQ and Russell 2000 dropped 0.27%, 0.28%, 0.29%, and 0.35%, respectively. That's not much damage considering how strong these indices have been over the past 9-10 weeks. There's still a solid uptrend in play on the S&P 500's 60 minute chart as follows, despite the mini 3 day losing streak:
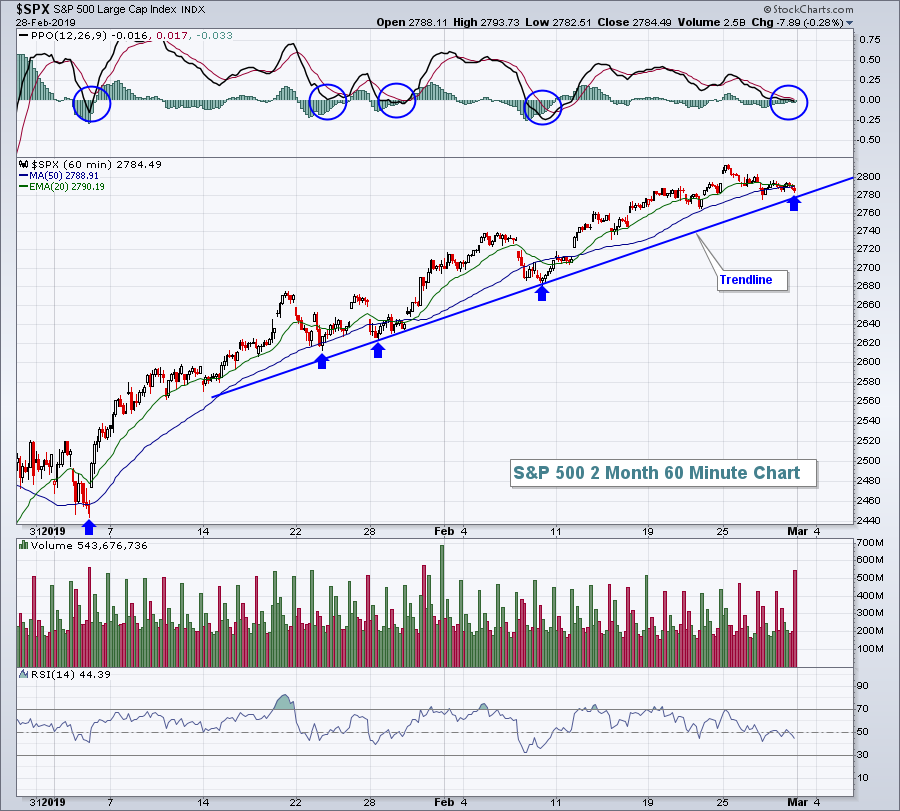 Each time the S&P 500 touches or moves just below the PPO centerline, a short-term bottom forms. Yesterday, we did it again, touching that zero line and this morning futures are higher once again. Given that this is the first calendar day of the month (the best day historically), I'd expect more strength today.
Defensive sectors led the action yesterday with utilities (XLU, +0.58%), consumer staples (XLP, +0.48%) and real estate (XLRE, +0.29%) atop the sector leaderboard. Materials (XLB, -1.22%) and energy (XLE, -1.00%) were the clear laggards. This shouldn't be too surprising as the U.S. Dollar Index ($USD) has rebounded slightly the past two trading sessions. I've provided much analysis in this blog over the years detailing how the XLB and XLE underperform on a relative basis when the USD is in an uptrend. I expect the relative weakness to continue here throughout 2019......or at least until a USD breakdown occurs.
Pre-Market Action
Stocks were strong in Asia overnight and that strength has carried over into Europe this morning, leading U.S. futures higher as well. With 30 minutes left to the opening bell, Dow Jones futures are pointing to a gain of 171 points.
Gold ($GOLD) lost its rising 20 day EMA yesterday and its weakness is continuing this morning. Be very careful with gold on this short-term breakdown as it's been underperforming the S&P 500 for 8 years as the U.S. Dollar Index ($USD) has been rising. Short-term breakdowns in a long-term relative downtrend should not be ignored in my opinion.
Crude oil ($WTIC) is flat this morning.
Current Outlook
Railroads ($DJUSRR) are generally a solid barometer of our domestic economy as they ship only in North America. So it's a confirming signal of economic strength for me when the group is performing well. Check out its 2019 performance thus far:
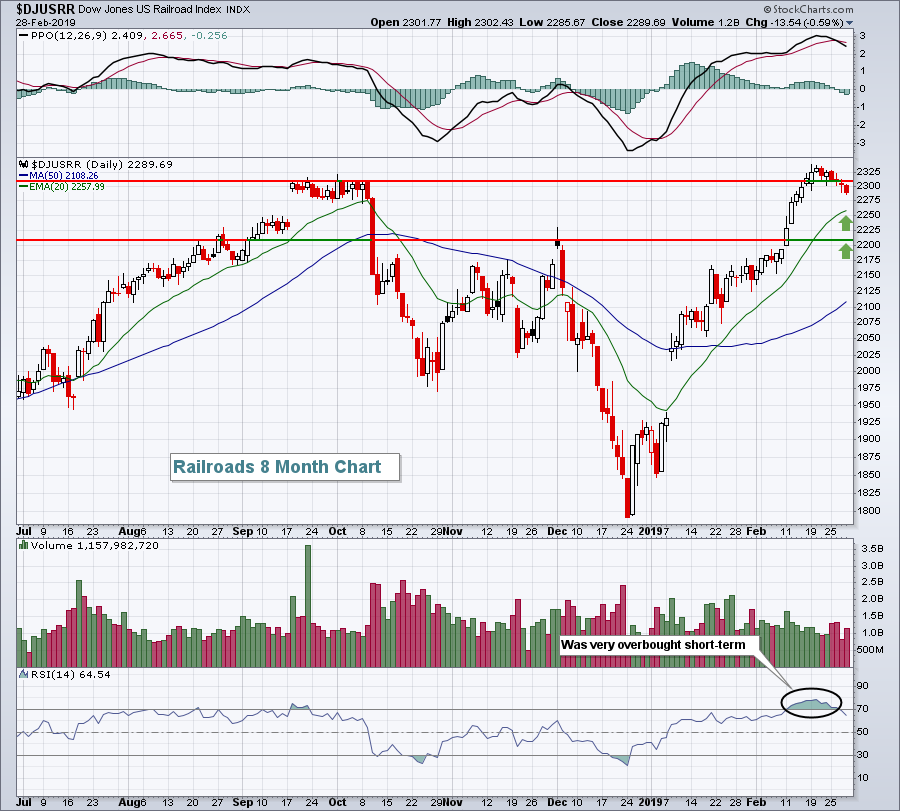 Railroads became very overbought in the near-term with its daily RSI approaching 80. We've seen selling recently to help relieve those overbought conditions, but further selling down to test the rising 20 day EMA and price support (green arrows) cannot be ruled out. Make no mistake about it, though, the DJUSRR is very strong technically and that bodes well for U.S. economic growth throughout 2019.
Sector/Industry Watch
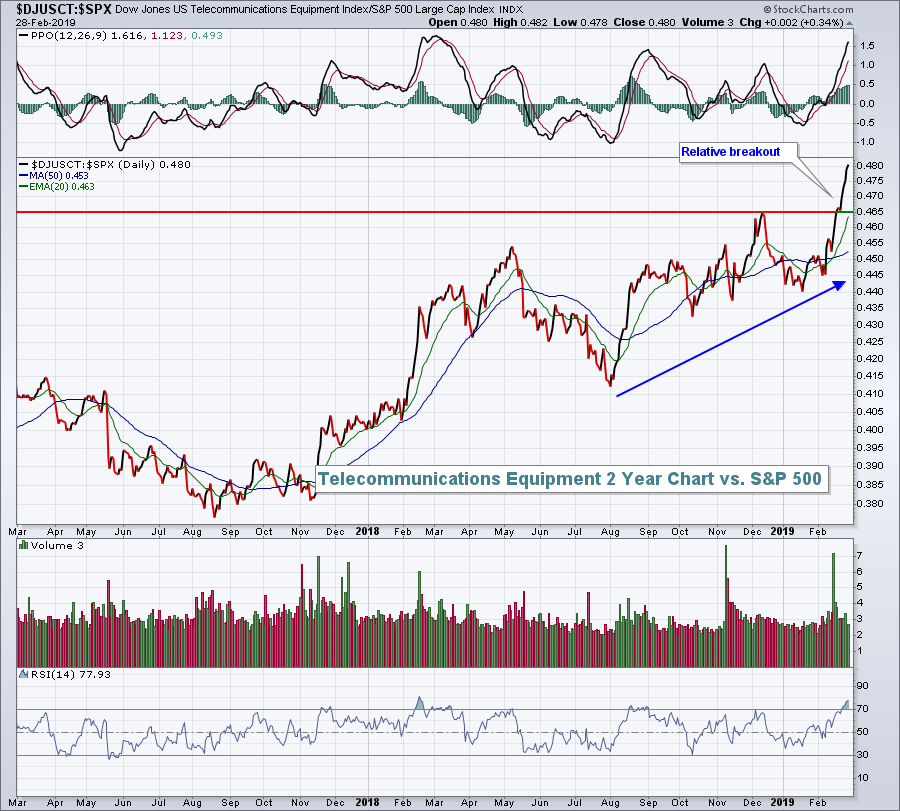
Telecommunications Equipment ($DJUSCT) has roared back as a relative leader in 2019 and I'll show you two different ways to visualize it. First, you can use a price relative chart ($DJUSCT:$SPX) to highlight the recent outperformance:
 Another way is to use the Relative Rotation Graph (RRG) charts and comparing the DJUSCT to the benchmark S&P 500. This is what it looks like currently:
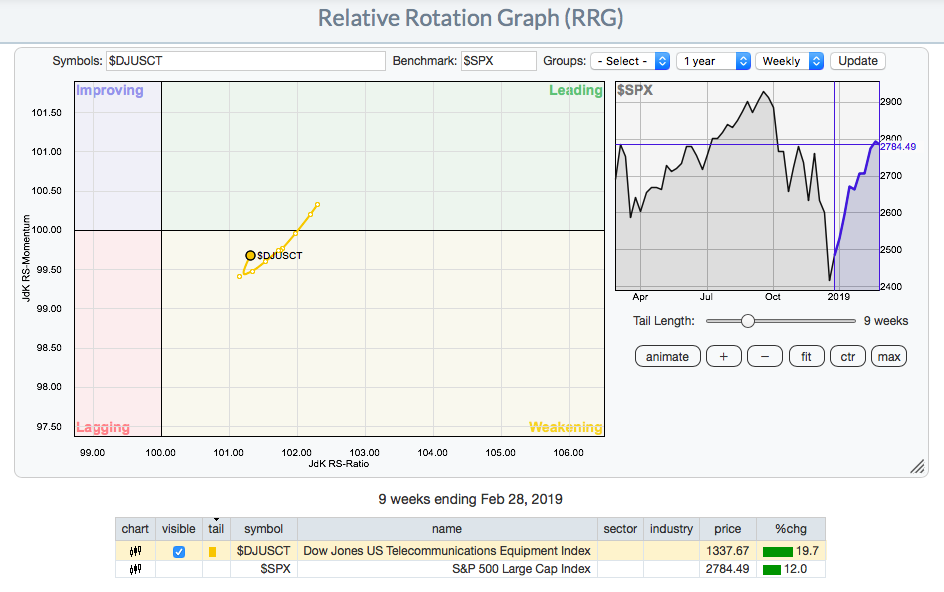 The key here is that the DJUSCT remained on the right hand side of the vertical RS-Ratio line. That tells us that the DJUSCT was still strong on a relative price basis, but simply had been losing relative momentum as the group consolidated. That turn higher back toward the leading quadrant is a very bullish signal.
Historical Tendencies
We have moved into a bullish historical period as the S&P 500 has produced annualized returns of +36.17% from March 1st through 5th since 1950. It's also noteworthy that March has been the 2nd best month for small cap (Russell 2000) stocks since 1987, trailing only December. Small caps have produced an annualized return of +20.06% over the last 31 years.
Key Earnings Reports
(actual vs. estimate)
FL: 1.56 vs 1.37
XRAY: .58 vs .54
Key Economic Reports
December personal income released at 8:30am EST: +1.0% (actual) vs. +0.4% (estimate)
December personal spending released at 8:30am EST: -0.5% (actual) vs. -0.3% (estimate)
December personal income released at 8:30am EST: -0.1% (actual) vs. +0.3% (estimate)
February ISM manufacturing index to be released at 10:00am EST: 55.0 (estimate)
February consumer sentiment to be released at 10:00am EST: 95.7 (estimate)
Happy trading!
Tom
