Market Recap for Thursday, April 18, 2019
Railroads ($DJUSRR, +2.37%) were led higher by Union Pacific's (UNP, +4.36%) strong quarterly earnings report and outlook. The DJUSRR has been a leader among industrials (XLI, +1.15%) for more than three years and that trend is easily continuing in 2019 as the group has broken out on both an absolute and relative basis:
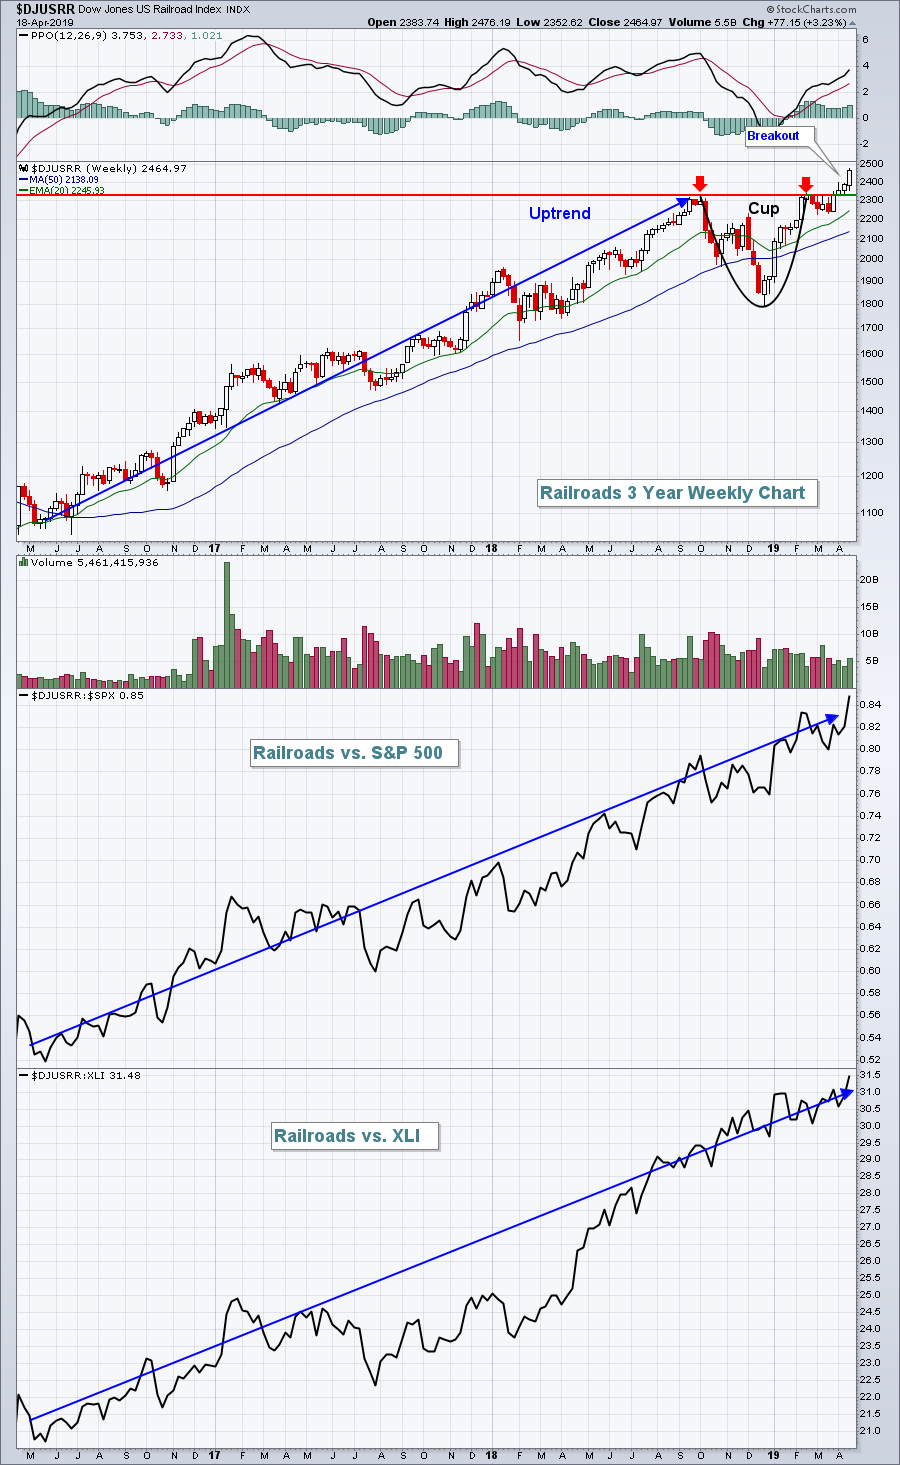 It's much easier to outperform the benchmark S&P 500 if you trade companies that belong to industry groups that are outperforming the S&P 500. Railroads are certainly one of those industries.
March retail sales came in much better-than-expected on Thursday, rising 1.6% and doubling the 0.8% rise expected. Stripping out autos, retail sales rose 1.2%, well above the consensus estimate of 0.7%. Throw in jobless claims at 192,000, well below the 206,000 estimate, and there was solid economic news for traders to close out the holiday-shortened week. Nonetheless, the equity rally was stifled, at least in part, by money rotating into the more defensive treasuries. The 10 year treasury yield ($TNX) fell 3 basis points to 2.56%.
A couple of Dow components, American Express (AXP, +1.71%) and The Travelers Cos. (TRV, +2.25%), saw positive reactions to their quarterly earnings helping to pace the Dow Jones advance (+0.42%), which led the major indices mostly higher. The Russell 2000 fell 0.12% as small caps lagged once again - a theme the past two months.
Energy (XLE, -0.47%) and financials (XLF, -0.29%) lagged from a sector perspective, although both groups still look poised to move higher, in my opinion.
Pre-Market Action
Crude oil ($WTIC) is spiking 2.7% this morning to $65.72 per barrel. Asia and Europe are both showing mixed markets overnight and this morning.
Dow Jones futures show some profit taking to kick off a busy earnings week. Dow futures are down 88 points as we open a new trading week. Historically, we do tend to see challenging equity markets this week.
Current Outlook
Financials (XLF) play a fairly critical role in the direction of the S&P 500. Over long periods of time, it's been proven that the relative strength of financials (XLF:$SPX) has a mostly positive correlation with the direction of the S&P 500. Put another way, if financials are outperforming, it's bullish for U.S. equities. If they're underperforming, it's not a great sign. Hopefully, the following chart will help to illustrate the importance of financials:
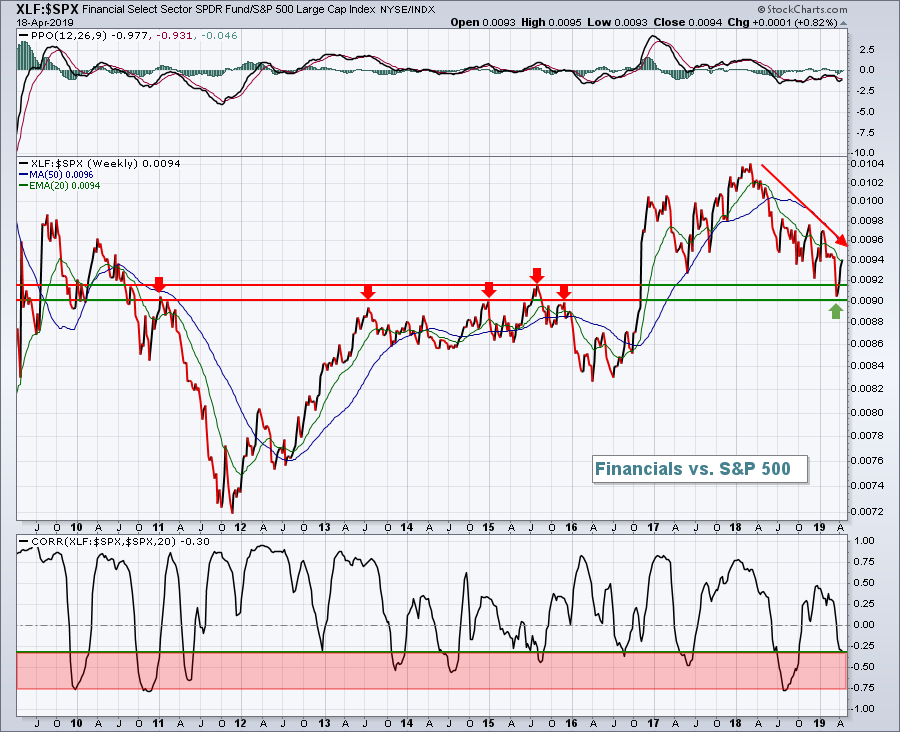 Looking first at the relative performance of financials (XLF:$SPX), I think it's rather apparent that the last 12 months have been challenging for financials. The falling TNX is surely not helping. But if you look at the bottom of the chart, you'll see a red shaded area that highlights the infrequent periods when we see an inverse correlation, which indicates one of two things. Either financials are outperforming the S&P 500, while the latter is falling.....or financials are underperforming in a bull market rally. In the case of 2018 into 2019, I believe we're seeing mostly a higher S&P 500 with relative weakness in financials. Now that the correlation coefficient has reached that "red zone", the odds are growing that financials' relative strength and the S&P 500 are likely to move together. So either the S&P 500 will drop to begin to track the relative weakness of the XLF....or the XLF is poised to outperform and lead the S&P 500 to all-time highs.
I'm expecting to see the latter.
Sector/Industry Watch
Financials (XLF) appear to be in the same stage they were in back in mid-2016, just before an explosive rally:
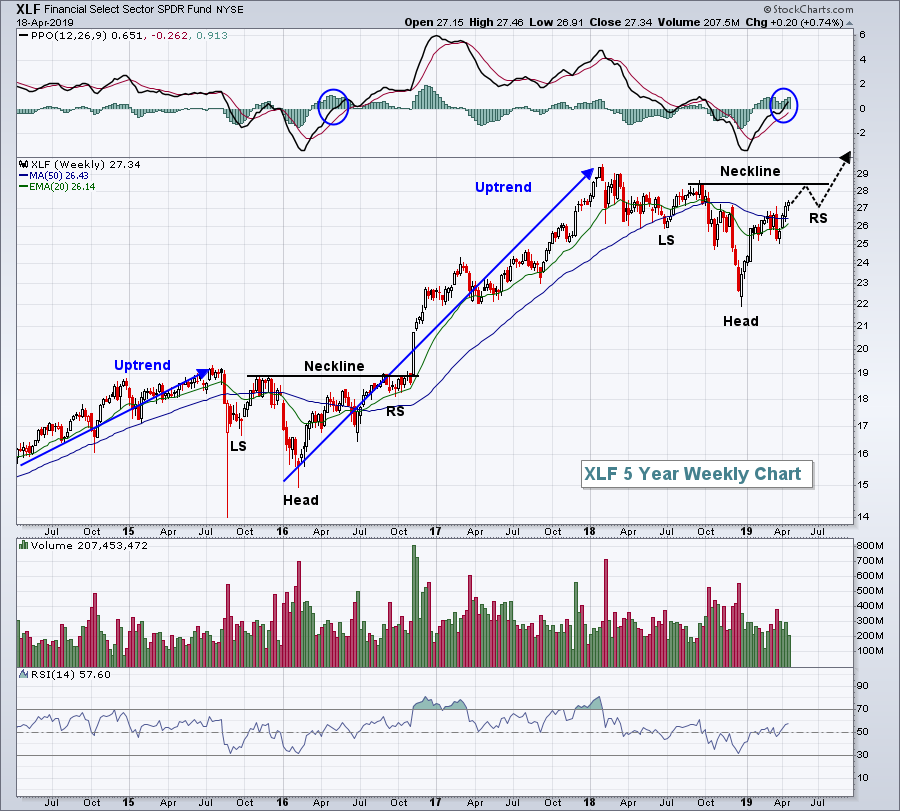 I look for continuation patterns as bullish charts show a period of consolidation. Obviously, the potential right side of a neckline and right shoulder preceding a breakout is nothing more than an educated guess. I wouldn't be shocked to see longer-term consolidation as the TNX has been very stubborn. I also wouldn't be shocked to see the TNX rise another 25-50 basis points over the next couple quarters with financials strengthening significantly. I would be much more shocked to see the S&P 500 turn lower with the TNX continuing to fall.
Monday Setups
I'm going to stick with the financials theme in terms of Monday setups this week.
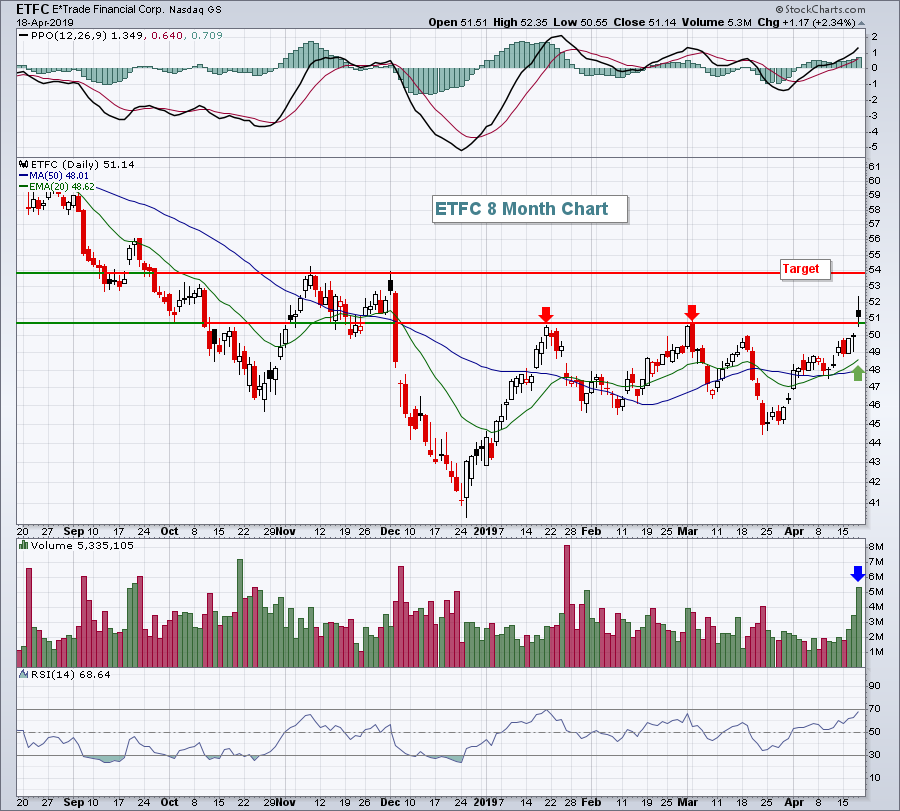
My pick this week will be E*Trade Financial Corp (ETFC), which traded and closed at a 2019 high on Thursday, clearing a January/March double top in the process. A pullback to gap support and/or the rising 20 day EMA is a possibility so multiple entries might not be a bad idea. I'd look for an initial target near 54, although I expect ETFC to be higher in time. Here's the chart:
 I'm beginning to see more financial stocks with character changes on their charts, suggesting that we're moving from downtrending stocks to uptrending. PPOs remaining above centerline support and rising 20 day EMAs holding as support will be two technical indications to watch for to support this theory.
Later today at 4:30pm EST, I'll be joining John Hopkins, President of EarningsBeats.com for a webinar to discuss (1) the state of the market, (2) several recent companies that reported strong earnings and look very solid technically, and (3) and potential blowout upcoming earnings reports to watch given those stocks' recent relative strength (ie, Wall Street is accumulating into earnings). To join me and John, you'll need to be at least a trial member of EarningsBeats.com. CLICK HERE for more details. I hope to see you there!
Historical Tendencies
With the exception of June, financials (XLF) tend to show relative strength from March through September. Every month in that period we see financials historically outperform the S&P 500 - except for June. Historical underperformance is typically found in October, November, January and February. Check this out:
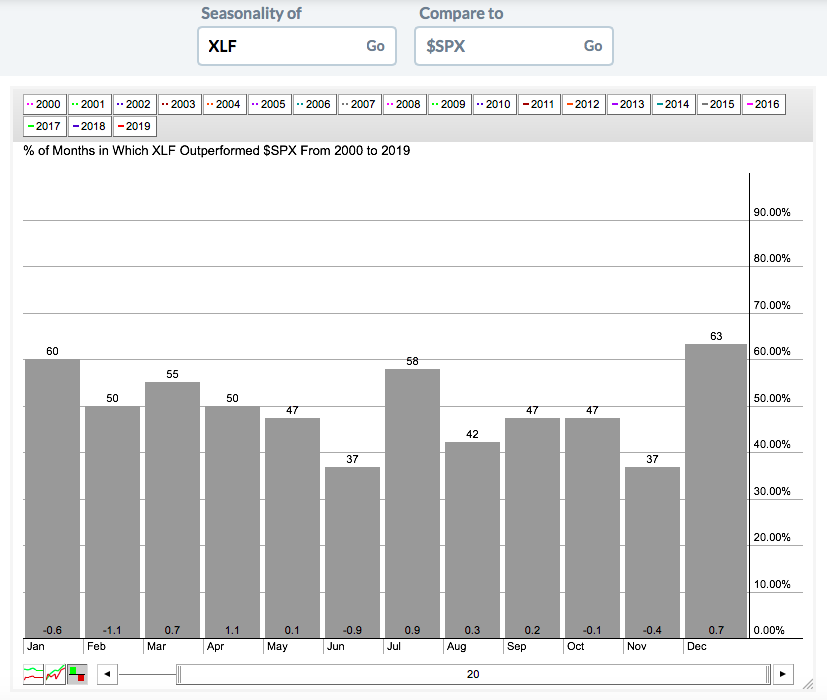 Again, this provides us no guarantees, but does further the bullish case for financials as we look in Q2 and Q3.
Key Earnings Reports
(actual vs. estimate):
GWW: 4.51 vs 4.42
HAL: .23 vs .23
KMB: 1.66 vs 1.54
LII: 1.68 vs 1.39
STLD: .91 vs .93
(reports after close, estimate provided):
ACC: .65
ALSN: 1.10
BRO: .36
CDNS: .50
CE: 2.49
ELS: 1.11
WHR: 3.04
ZION: 1.05
Key Economic Reports
March existing home sales to be released at 10:00am EST: 5,300,000 (estimate)
Happy trading!
Tom
