Market Recap for Monday, April 8, 2019
Crude oil prices ($WTIC, +2.09%) surged once again on Monday, and have now climbed 50% off their December low. While energy (XLE, +0.44%) has been a major beneficiary, as we would expect, the XLE has been mired in a downtrend vs. the benchmark S&P 500. How can that be? If crude oil prices have risen 50% in a little more than 3 months, why aren't energy stocks soaring? It's all about the space, about the space...
The U.S. Dollar Index ($USD) remains in an uptrend and the relationship between the USD and the relative strength of energy (and materials) has been well-documented here in Trading Places. You only need to take one look at the chart below for it to become crystal clear:
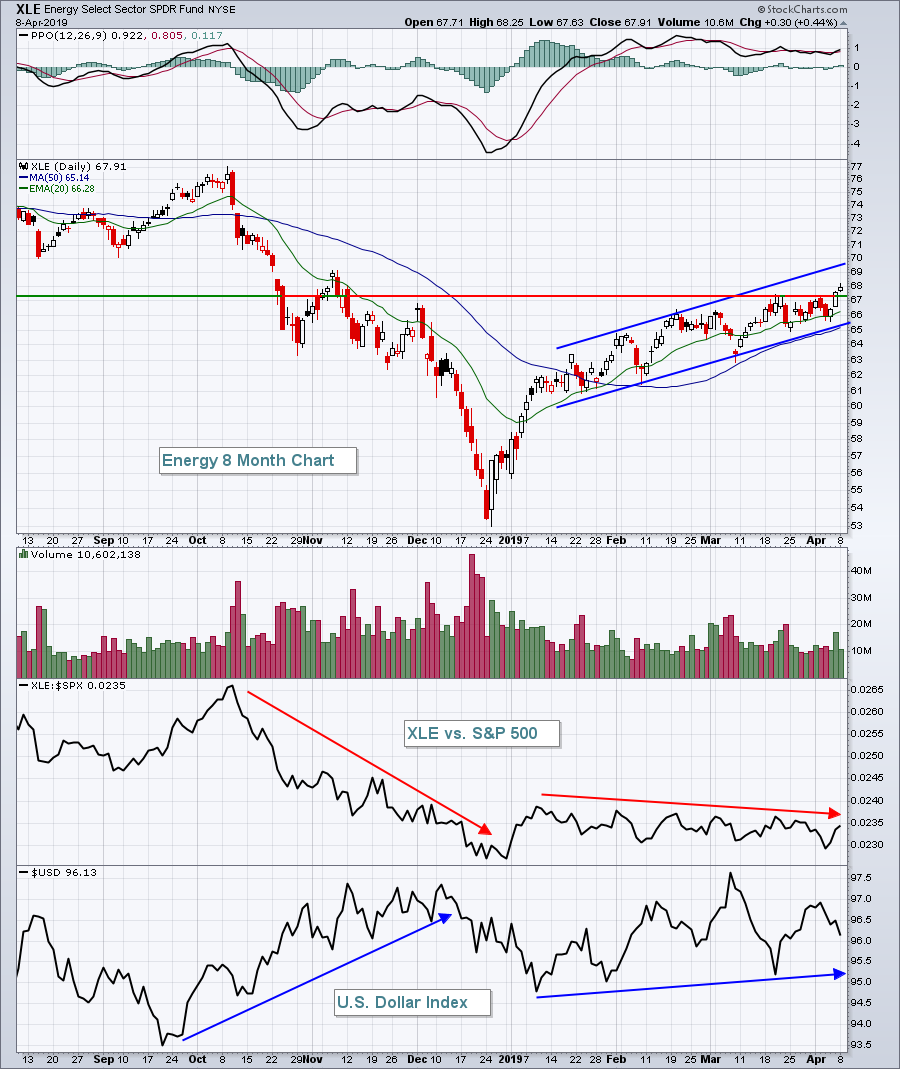 The XLE is at a 5 month high, so there is solid absolute performance. But other more aggressive areas of the market are outperforming energy because of the dollar. The rising dollar is providing headwinds for energy, unfortunately. The rising bottoms on the USD coincide perfectly with the declining tops on the XLE:$SPX. The strength in the dollar is holding back energy and you need to realize it. It's not as much about crude oil prices as it is the direction of the dollar.
Consumer staples (XLP, +0.41%), technology (XLK, +0.38%) and consumer discretionary (XLY, +0.36%) also performed well on Monday, but it was a mixed bag as utilities (XLU, -0.71%), real estate (XLRE, -0.49%) and industrials (XLI, -0.43%) lagged.
Pre-Market Action
Crude oil ($WTIC) and the 10 year treasury yield ($TNX) are both down slightly, leading to slightly lower U.S. futures. Asian markets were mixed overnight, while Europe is in the red. The German DAX ($DAX) is down 0.57% at last check, leading to weak Dow Jones futures, currently down 58 points.
Current Outlook
I discuss railroads ($DJUSRR, +0.57%) often and for good reason. They're like a fire starter for industrials, lighting the path for relative strength in the group. We know if industrials are performing well, it's typically a very good signal about our economic growth ahead. With this in mind, check out the following chart:
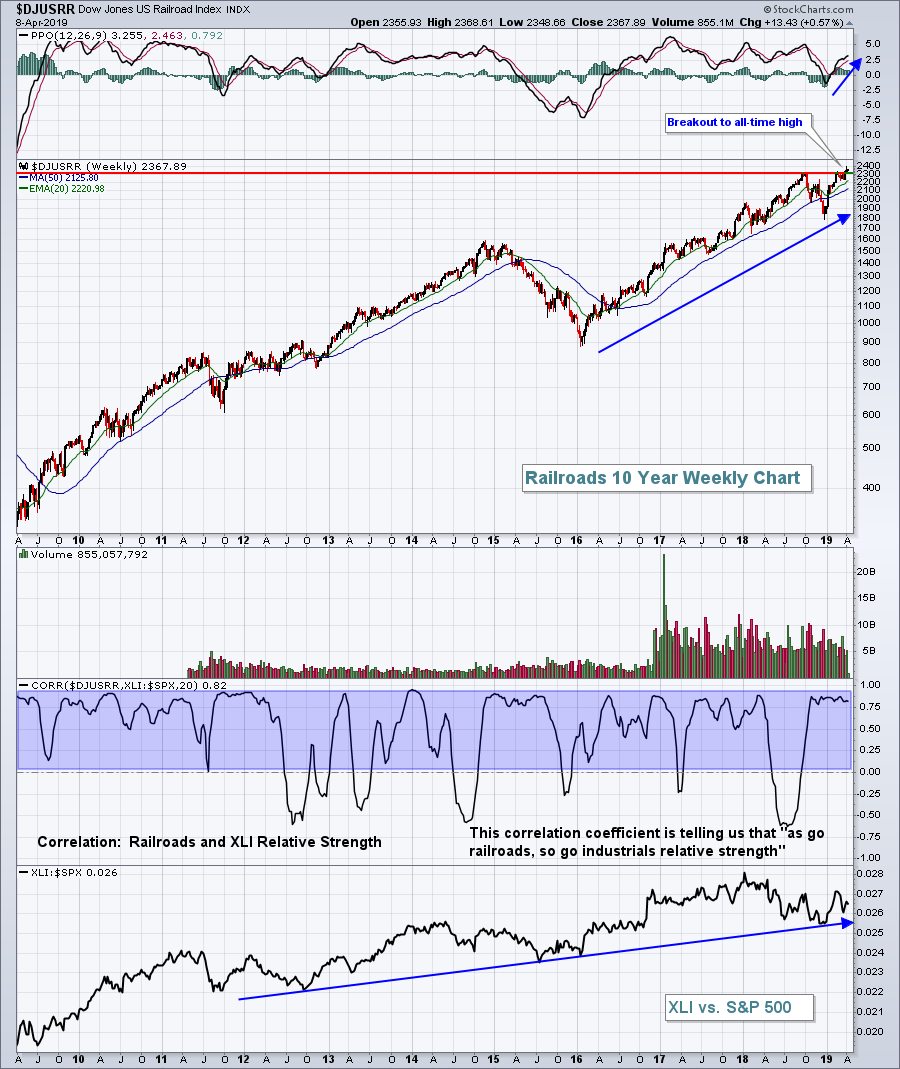 The DJUSRR recently broke out to an all-time high, so are on a technical buy signal right now. The blue shaded area above highlights the positive correlation between the direction of the DJUSRR and the relative strength of industrials vs. the benchmark S&P 500. While it isn't perfect positive correlation by any means, it suggests the odds are that industrials will be outperforming in the weeks and months ahead.
This aligns rather well with the seasonal relative strength typically enjoyed by industrials during the month of April:
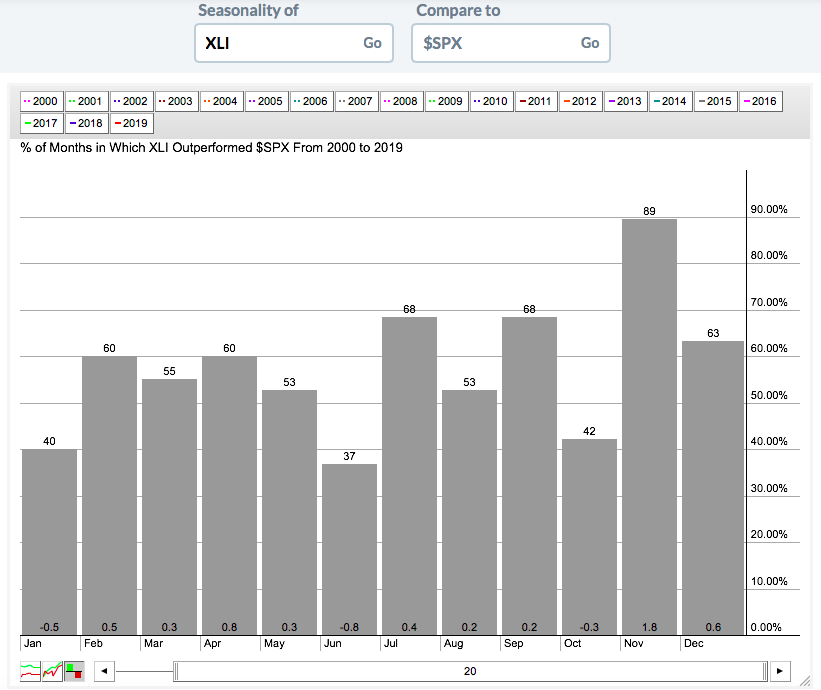 The XLI has outperformed the S&P 500 60% of Aprils this century, but the average outperformance is +0.8%, the second-highest relative outperformance throughout the year, trailing only November's +1.8%.
Sector/Industry Watch
Auto parts ($DJUSAT, +1.12%) broke out to a fresh 2019 high on Monday, and will be looking for further strength ahead. Its PPO is accelerating in bullish fashion just above the zero line, indicative potentially of relative strength as we enter earnings season:
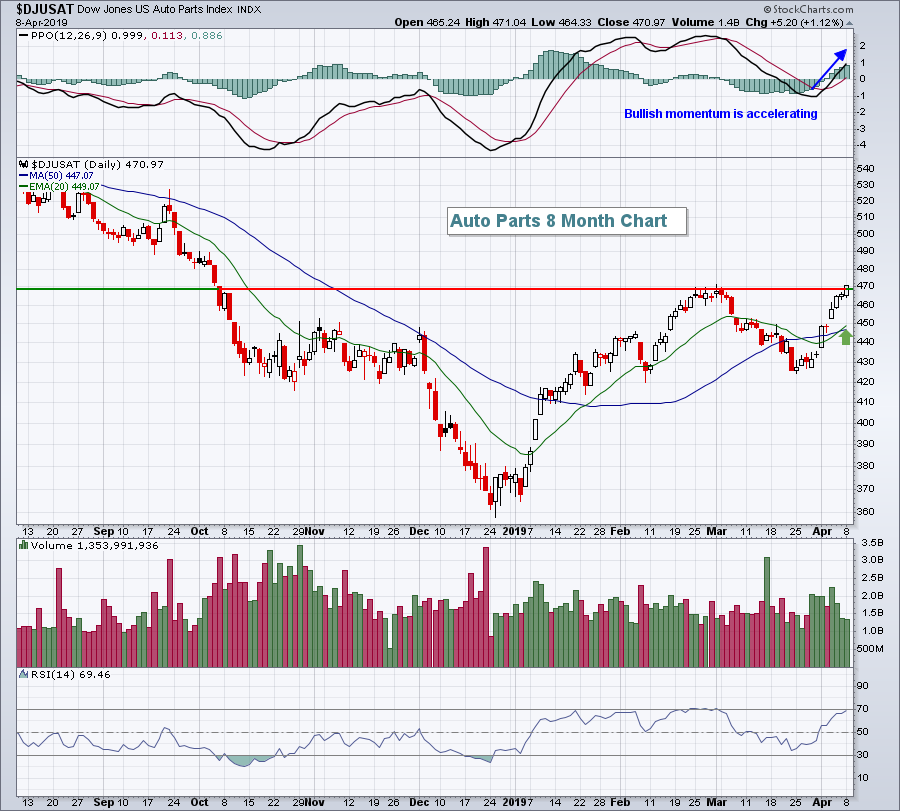 RSI has been problematic and the group's RSI is currently at 69, so the key will be whether the DJUSAT can hold its rising 20 day EMA (green arrow) on pullbacks.
Historical Tendencies
The technology sector (XLK) has tended to underperform the S&P 500 during April throughout the past 10 years, despite mostly a raging bull market:
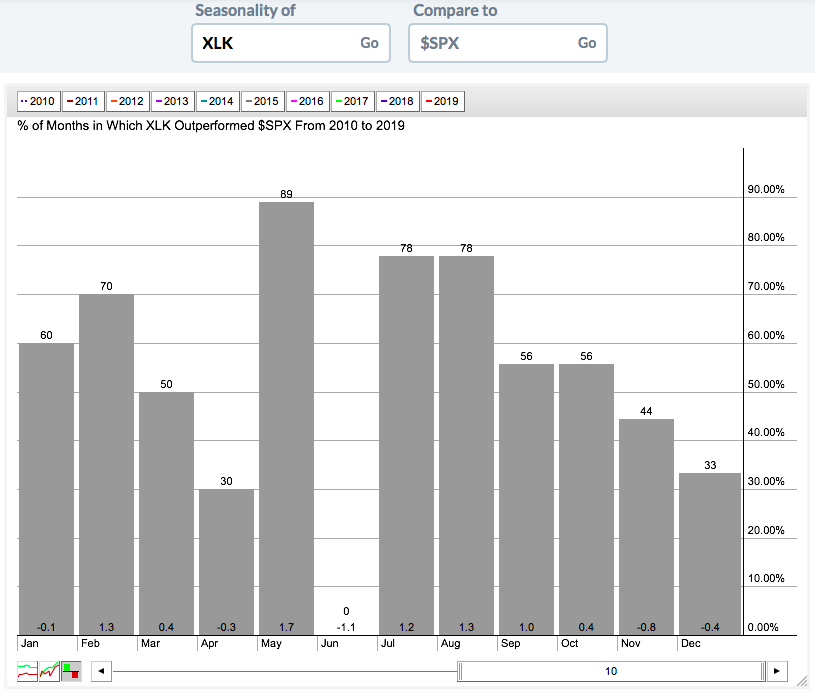 The good news, however, is that May has been off the charts for technology stocks on a relative basis.
Key Earnings Reports
(actual vs. estimate):
SJR: .22 - estimate, awaiting results
(reports after close, estimate provided):
WDFC: 1.12
Key Economic Reports
None
Happy trading!
Tom
