Market Recap for Wednesday, April 10, 2019
Small cap stocks enjoyed a huge day, carrying Wall Street higher. The Russell 2000 surged 1.40% and is nearing a major neckline resistance that, if broken, would suggest much higher prices for small caps:
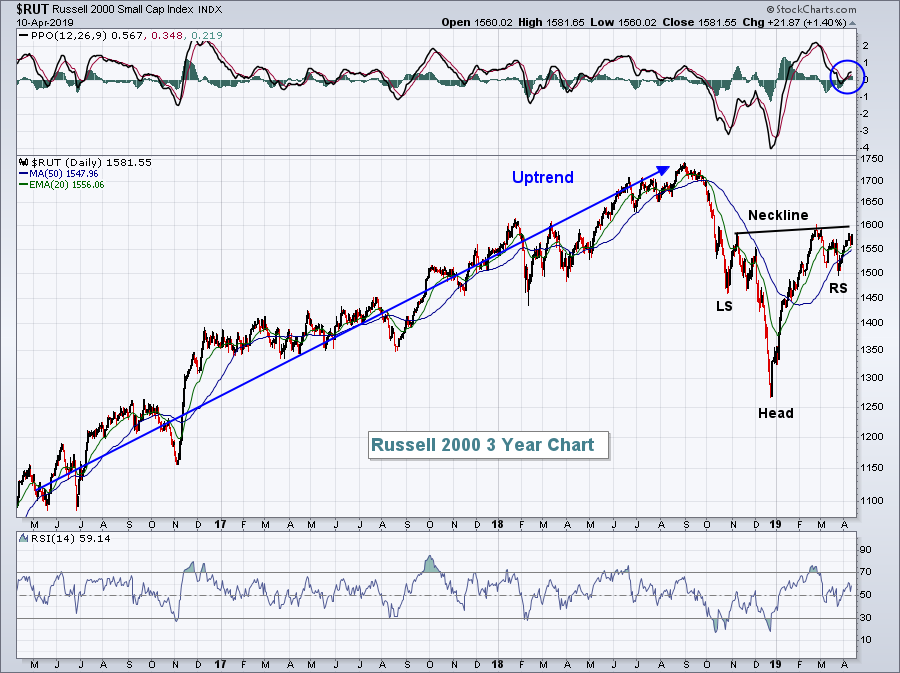 Clearing 1600 would be a big deal technically and we're not far from doing just that. The S&P 500, which gained 0.35% yesterday, is within 2% of its all-time high, so we could see very important technical levels cleared on multiple major indices simultaneously. It would be difficult to argue the bullish implications of such a rally.
The NASDAQ gained 0.59% and is within a whisker of its psychological 8000 level. The NASDAQ also is within 2% of an all-time high.
Sector strength came in the form of real estate (XLRE, +0.80%) and technology (XLK, +0.70%), the two sectors with the highest SCTR scores, 96 and 92, respectively. The latter group benefited from a soaring telecommunications equipment industry ($DJUSCT, +1.26%):
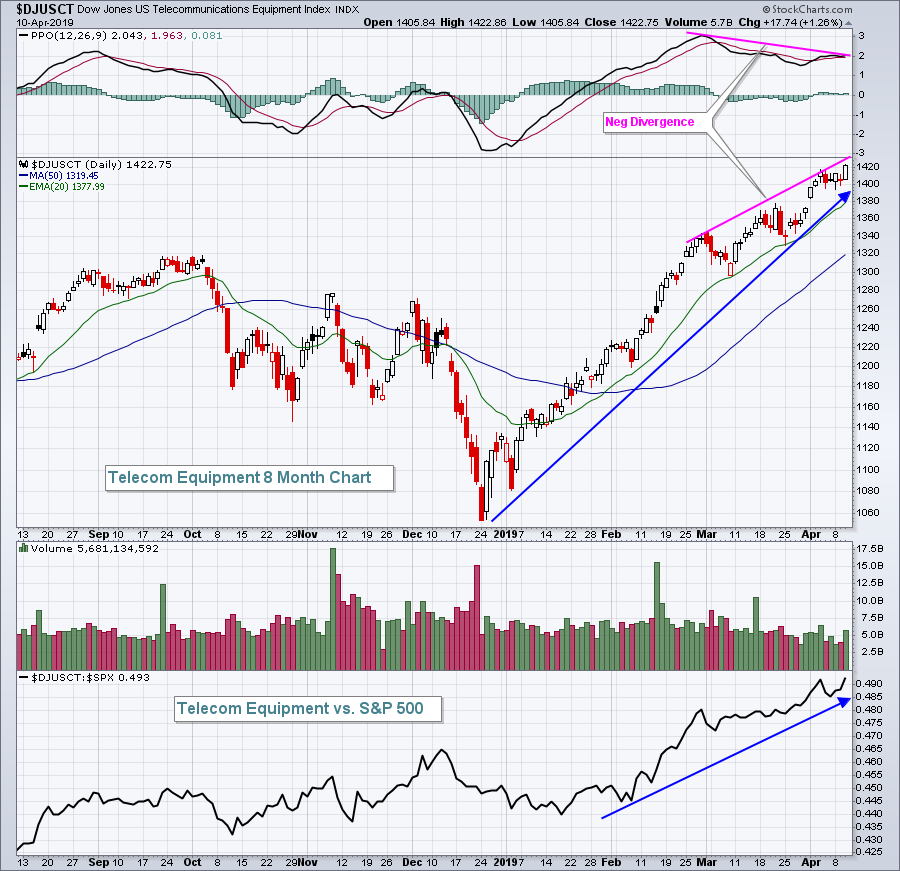 Cisco Systems (CSCO) has been a leader in this space and you can see by the bottom of the chart above, the DJUSCT has been a major relative leader in the current stock market rally.
Utilities (XLU, -0.31%) was the only sector that really struggled on Wednesday.
Pre-Market Action
U.S. stocks are trying to digest this morning's mixed economic reports. Initial jobless claims moved below 200,000, a major milestone, but inflation at the producer level was much higher than expected. This combination, while just one day's worth of reports, would suggest the Fed might lean towards raising the fed funds rate.
The U.S. Dollar ($USD) is showing strength this morning, putting significant downward pressure on many commodities. Gold ($GOLD) is down 1%, while silver ($SILVER) is tumbling closer to 2%. Crude oil prices ($WTIC) are also down just over 1%.
Meanwhile, Asian markets were mostly lower overnight and European markets are mixed this morning.
Dow Jones futures are up, but by only 28 points as we approach the opening bell.
Current Outlook
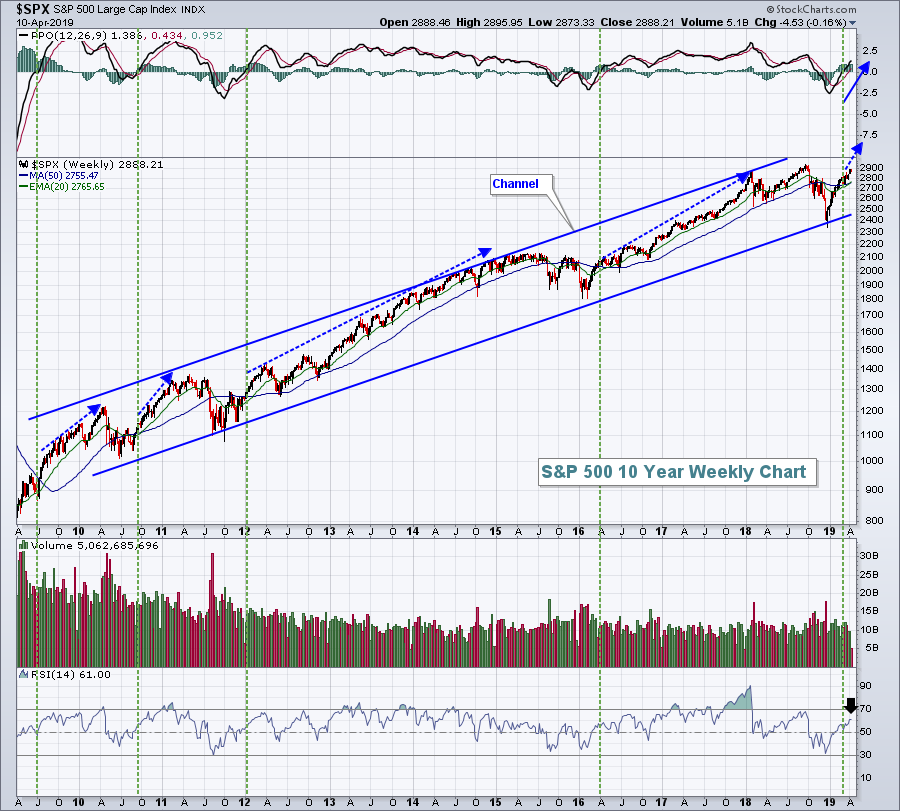
Let's step back and take a longer-term weekly look at the S&P 500:
 Here are a few points to consider as we look forward:
(1) The green vertical lines mark bullish PPO centerline crossovers. In a bull market, these crossovers have preceded significant rallies.
(2) The weekly RSI is only at 61. While that may seem impossible given the huge rally off the December low, the current picture is similar to the start of 2012 and in April 2016. In both cases, we saw much higher prices a couple years later.
(3) If we connect significant price lows (lower blue upsloping line), that marks a trendline worth watching. By dragging that line to connect tops, it provides us a perfect channel to perhaps help us identify tops later in 2019 or 2020.
I remain very bullish and expect we will test the top of this channel over the course of the next year.
Sector/Industry Watch
Biotechs ($DJUSBT, +1.16%) rallied on Wednesday to test key overhead price resistance. Will we finally make this breakout?
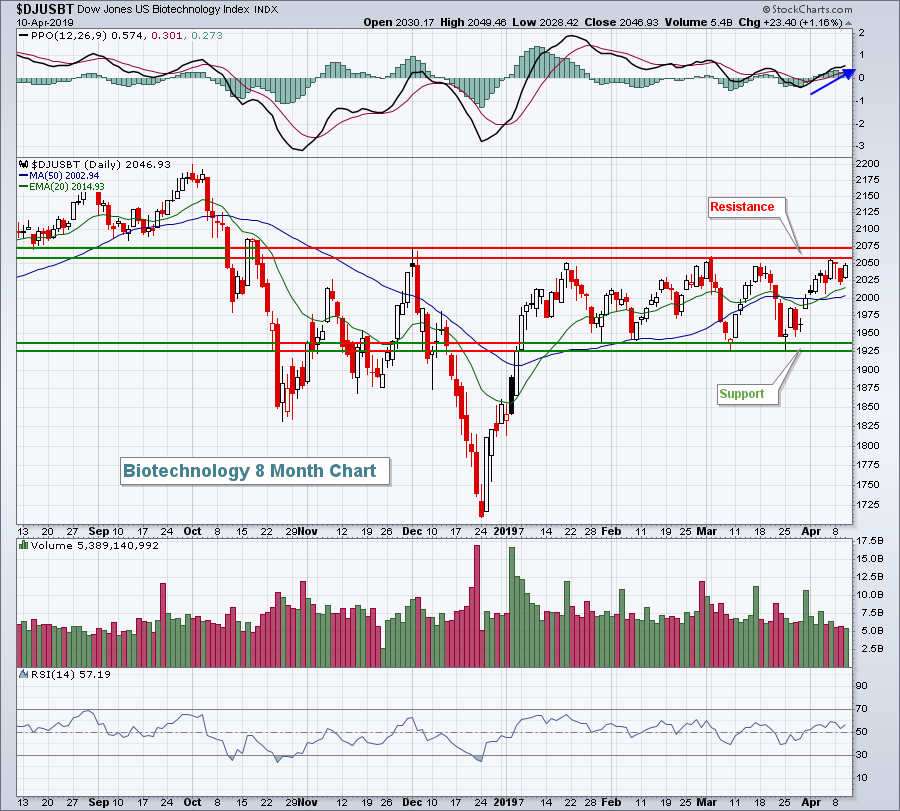 The PPO is above the centerline and rising, so a breakout is more likely to be sustained, in my opinion, as momentum is strong.
Historical Tendencies
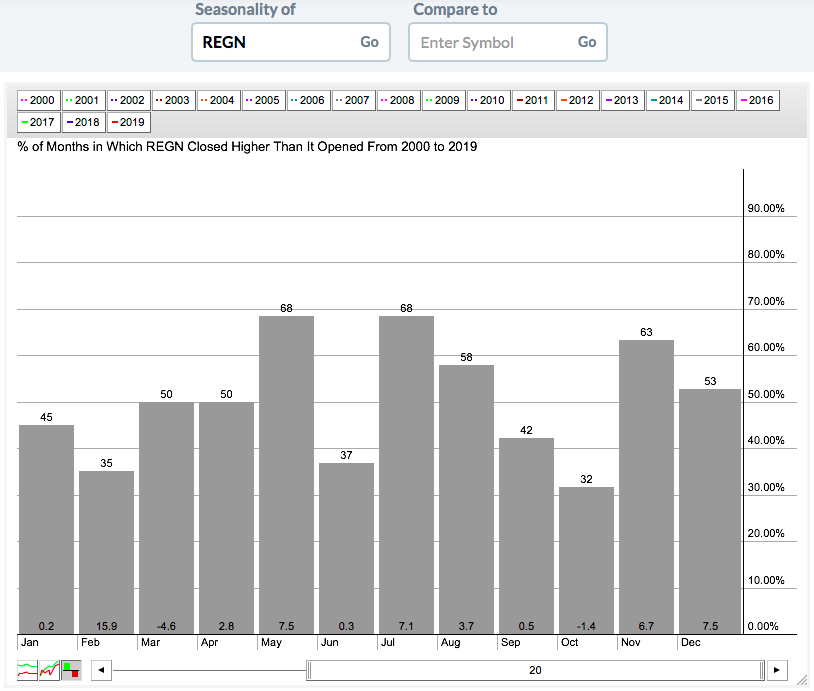
Regeneron Pharmaceuticals (REGN, +3.16%) had a solid day on Wednesday, climbing back above its 20 day EMA. While biotechs have struggled in 2019, they're on the verge of a significant breakout as discussed above in the Sector/Industry Watch section. REGN likes the April through August period seasonally (averaging +21.4% during these five months over the past 20 years) so it might be worth considering, especially if biotechs finally break out:
 REGN has been a solid performer in the biotech area for many years and has a $44 billion market cap, so it's a large cap biotech.
Key Earnings Reports
(actual vs. estimate):
CBSH: .85 vs .91
FAST: .68 vs .67
Key Economic Reports
Initial jobless claims released at 8:30am EST: 196,000 (actual) vs. 211,000 (estimate)
March PPI released at 8:30am EST: +0.6% (actual) vs. +0.4% (estimate)
March Core PPI released at 8:30am EST: +0.3% (actual) vs. +0.2% (estimate)
Happy trading!
Tom
