Market Recap for Thursday, May 2, 2019
Energy (XLE, -1.74%) took yet another tumble on Thursday, which dampened an otherwise decent recovery from intraday morning lows in our major indices. The Dow Jones was the big loser, dropping 0.46%, while the small cap Russell 2000 index rebounded nicely, finishing the session with a 0.40% gain. The S&P 500 and NASDAQ fell 0.21% and 0.16%, respectively.
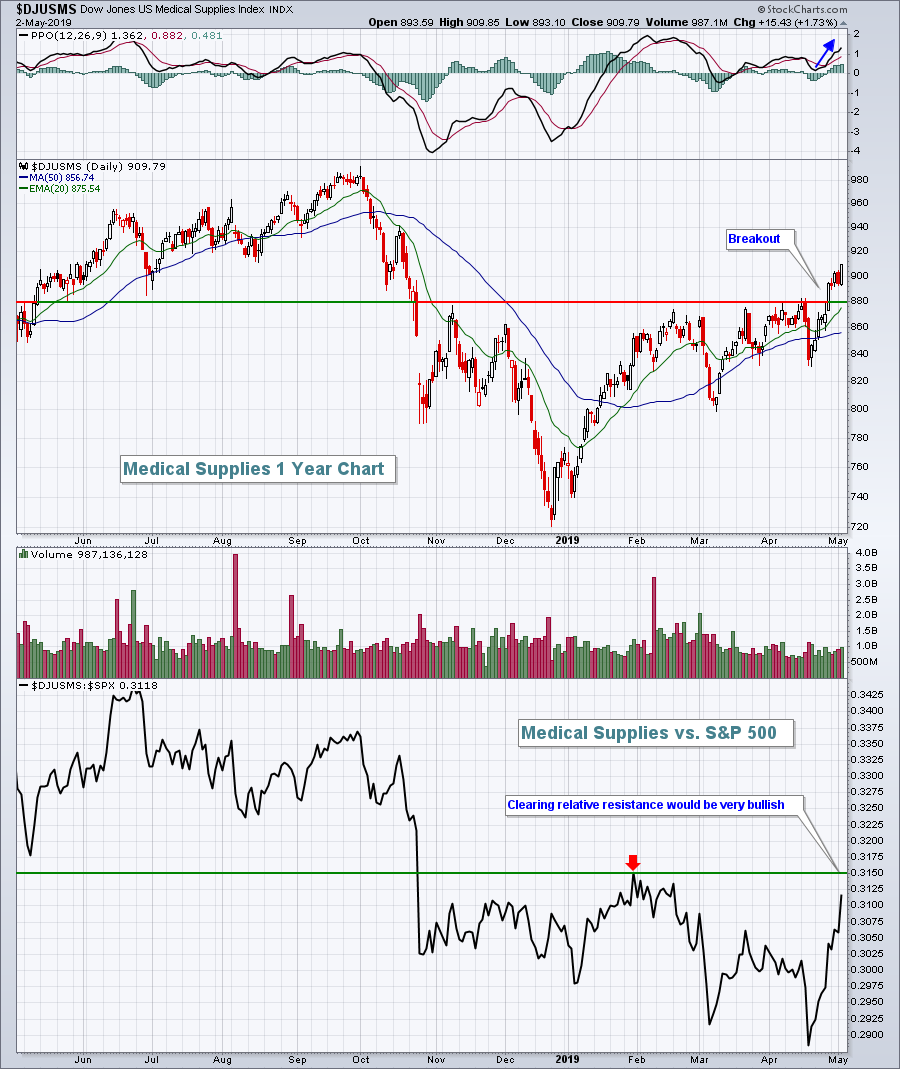
Healthcare (XLV, +0.43%) aided the afternoon recovery as all five industry groups in this sector ended higher, led by medical supplies ($DJUSMS, +1.73%) and medical equipment ($DJUSAM, +1.04%). The DJUSMS, in particular, is really starting to build strength as you can see below:
A hot mortgage finance industry ($DJUSMF, +0.47%) helped lift financials (XLF, +0.11%), while real estate (XLRE, +0.19%) managed to end Thursday's session with gains.
The U.S. Dollar Index ($USD) has bounced nicely off its recent 20 day EMA test, adding further pressure to materials (XLB, -0.51%) and energy stocks.
Pre-Market Action
April nonfarm payrolls surged as unemployment fell to 3.6%, its lowest level since 1969. Yet the 10 year treasury yield ($TNX) hasn't budged as bond traders remain defiant about the Fed's "transitory" inflation comments from Wednesday afternoon. The TNX is down a basis point to 2.54% on a very strong jobs report. What is that telling us? The bond market continues to send the signal that deflation is more of a concern at this point than inflation, and that we should lower rates, not raise them.
We saw mostly strength overnight in Asia and the same holds true for Europe this morning.
Dow Jones futures are higher by 131 points with 30 minutes left to the opening bell.
Current Outlook
I tend to follow the NASDAQ more closely than the S&P 500 because the NASDAQ is the more aggressive index. During bull market advances, I tend to trade more NASDAQ stocks. For the first time in awhile, the 60 minute chart shows that short-term momentum belongs to the bears. We ended yesterday's session clearly in a downtrend, despite the recovery over the final few hours. The declining 20 hour EMA will be the first test for the bulls. Given the positive futures this morning, we could see the NASDAQ gap higher and take off. But failure to do so would be reason to pause since we've already had such a huge start to 2019:
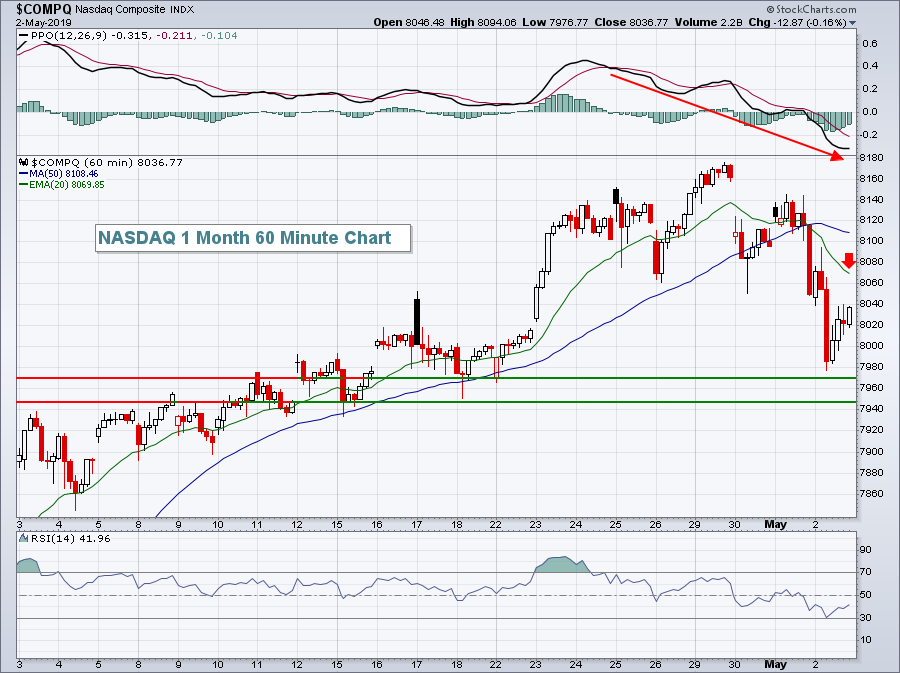 After gapping higher on April 17th, the following low near 7950 becomes a fairly important short-term support level if we do see a failure to follow through on today's pre-market strength.
Sector/Industry Watch
While energy (XLE) appeared to be strengthening in 2019, it really hasn't. The relative weakness is very obvious when we stretch the chart out and look on a long-term basis. Check out this 5 year weekly chart:
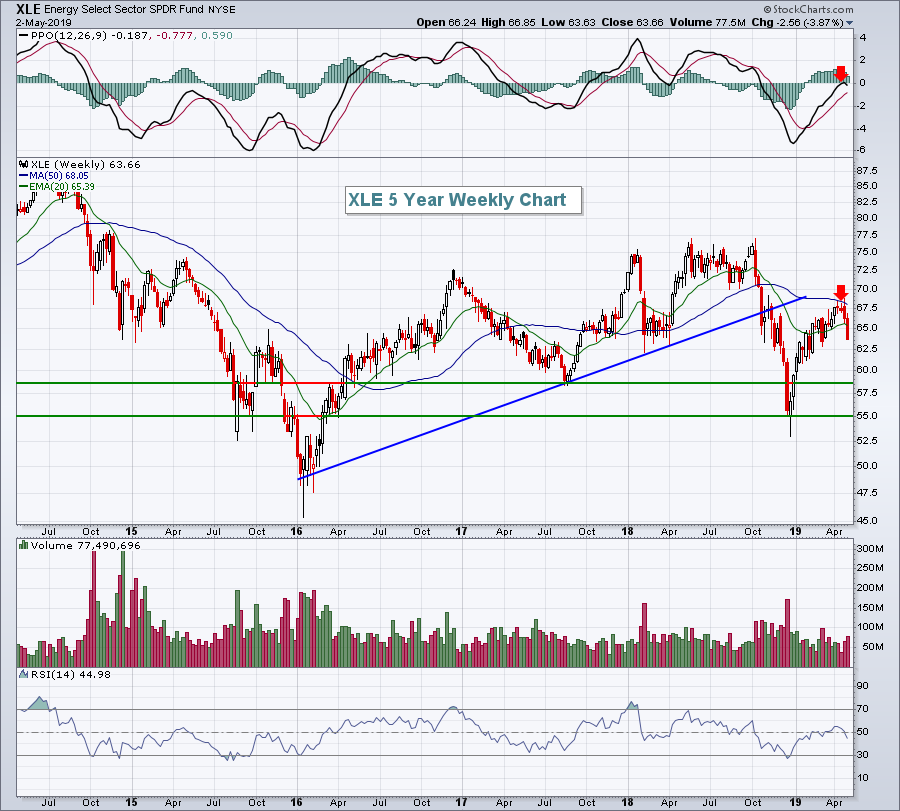 Those red arrows mark key overhead resistance at the 50 week SMA and also at the PPO centerline. The weekly momentum looked good until hitting those two areas and now the XLE appears to be rolling over. This sector, along with materials (XLB) really needs a weak U.S. Dollar ($USD) environment to thrive and, unfortunately, that is not the case right now.
Historical Tendencies
Throughout the bull market (since 2009), XLE has performed poorly relative to the benchmark S&P 500 during the month of May. It's only outperformed in 2 Mays over that period (20%) and its average underperformance has been -2.5%, by far the worst of any calendar month:
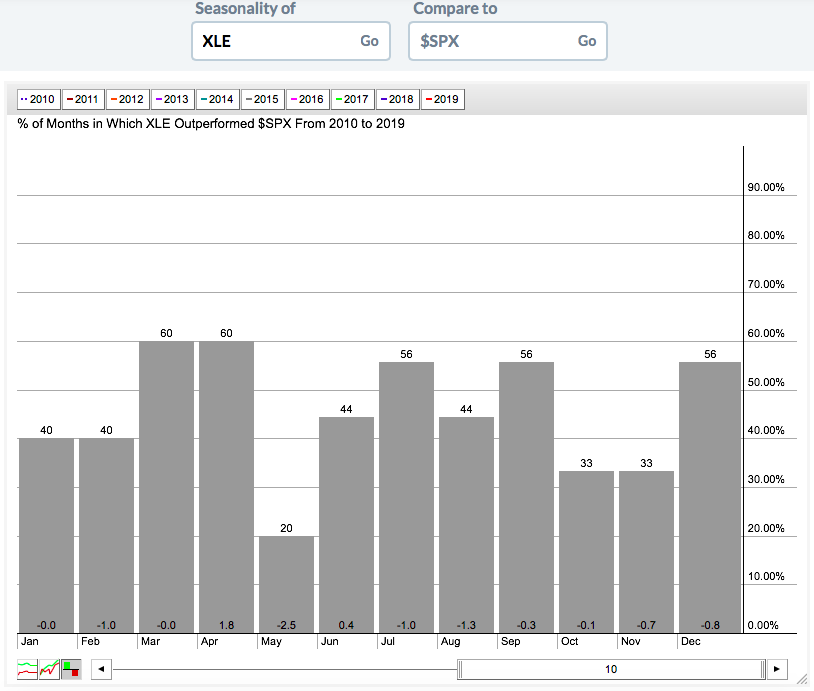 Seasonality is simply one more indicator that is telling us to remain very cautious the energy group.
Key Earnings Reports
(actual vs. estimate):
AMT: 1.84 vs 1.86
BIP: .88 vs .84
CBOE: 1.11 vs .99
D: 1.10 vs 1.12
DISH: .65 vs .65
EQNR: .46 vs .40
FCAU: .41 vs .44
NBL: (.09) vs (.08)
NVO: .62 - estimate, awaiting results
TRP: .80 vs .76
VST: .15 vs .20
WPC: 1.21 vs 1.26
XRAY: .49 vs .38
Key Economic Reports
April nonfarm payrolls released at 8:30am EST: 263,000 (actual) vs. 180,000 (estimate)
April private payrolls released at 8:30am EST: 236,000 (actual) vs. 178,000 (estimate)
April unemployment rate released at 8:30am EST: 3.6% (actual) vs. 3.8% (estimate)
April average hourly earnings released at 8:30am EST: +0.2% (actual) vs. +0.2% (estimate)
April PMI services index to be released at 9:45am EST: 52.8 (estimate)
April ISM non-manufacturing index to be released at 10:00am EST: 57.3 (estimate)
Happy trading!
Tom
