Market Recap for Thursday, May 30, 2019
Dollar General (DG, +7.16%) and Dollar Tree (DLTR, +3.14%) provided a lift to consumer discretionary stocks (XLY, +0.65%) after releasing their latest quarterly results, but PVH Corp (PVH, -14.87%) tumbled, further compromising an already-weak clothing & accessories group ($DJUSCF, -1.52%). And that sums up Thursday's yo-yo session, though the bulls did pull out a minor victory by the close. Most of our major indices finished in positive territory with the small cap Russell 2000 once again the laggard, losing 0.30%.
Despite the NASDAQ's "leadership" as it gained a whopping 0.27%, the daily technical picture remains bearish:
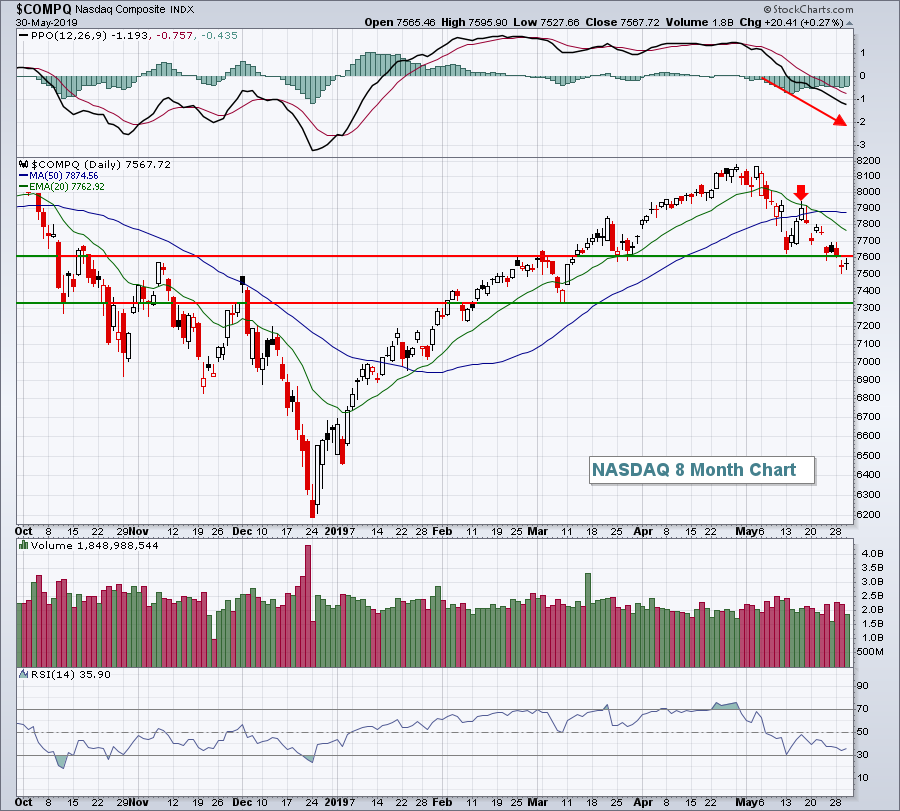 The NASDAQ remains below its 20 day EMA, which recently crossed beneath its 50 day SMA (bearish "death cross"). The daily chart will show little technical improvement until it clears its 20 day EMA. Until then, expect rallies to fail short-term. The two price support levels identified above formed with high volatility, so they're important from a short- to intermediate-term perspective. Loss of the lower March support line could trigger a much more significant decline.
The second estimate of GDP was better than expected with a reading of 3.1%. Consensus estimates were pegged at 3.0%, 0.2% lower than the initial GDP reading last month of 3.2%. But as volatility picks up, the stock market trades much more on emotion than technicals or fundamentals or seasonal patterns. We always have to keep our guard up as the Volatility Index ($VIX) rises above 16-17. Yesterday's close was 17.30 and we can expect higher VIX readings today given the very weak stock futures.
Pre-Market Action
In a surprise move (at least to U.S. financial markets), President Trump has imposed a 5% tariff on Mexican imports as an attempt to slow the rate of illegal immigrant entry into the U.S. from Mexico. World markets have initially reacted quite negatively to the news as they view such a move as another potential roadblock to global growth.
The 10 year treasury yield ($TNX), not too surprisingly, has fallen 5 basis points to 2.18%. Crude oil prices ($WTIC) are down over 2% this morning and nearing $55 per barrel. Asian markets were mostly lower overnight and European markets are being hit hard with the German DAX ($DAX) down almost 2%.
Given the rising Volatility Index ($VIX), selling here in the U.S. could escalate rapidly. I usually find that it's best to get out of the way of stampeding sellers and await better opportunities to trade when the volatility dust settles.
Dow Jones futures are down 250 points with just under 30 minutes to the opening bell.
Current Outlook
The stock market sends us technical clues before fundamental news hits. In the case of recessions, we normally see a slowdown in the rate of job growth just before an official recession is reported. There are many calling for a recession now, but the jobs picture isn't yet showing it:
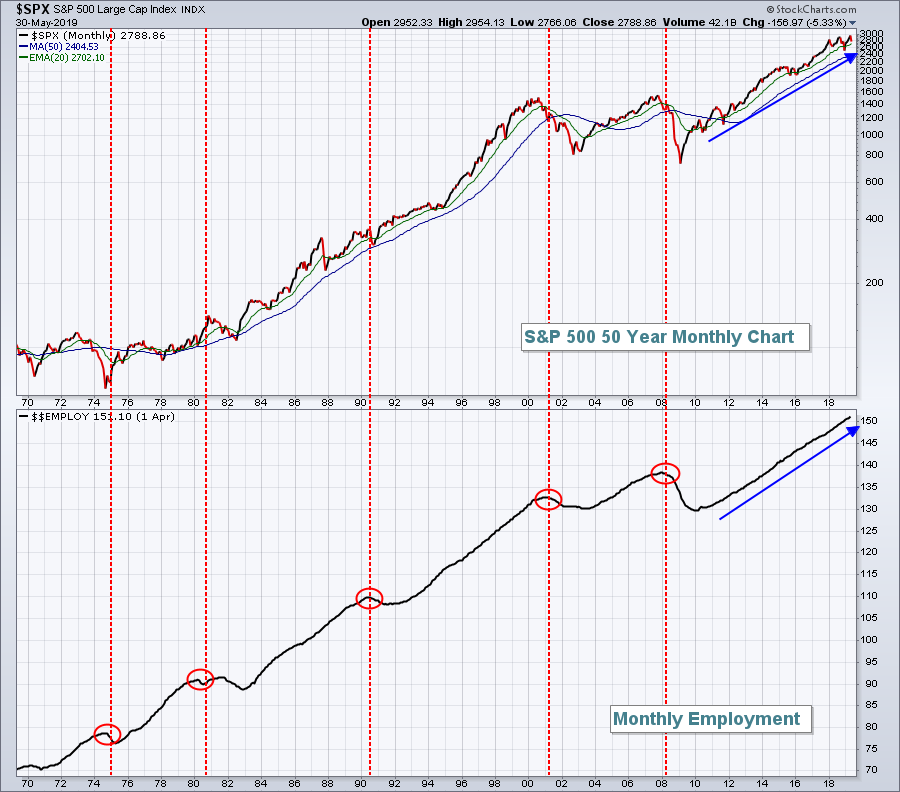 I see no deterioration in employment ($$EMPLOY), but that is something that has occurred just before or during the past several recessions. Our next nonfarm payrolls report will be released one week from today. That will be a very closely watched report to determine if there's any substance to all the recession talk.
Sector/Industry Watch
Outside of clothing & accessories ($DJUSCF, -5.67%), durable household products ($DJUSHD, -3.69%) have been the worst performing consumer discretionary industry group over the past week. One look at a 2 year charts SCREAMS at us to STAY AWAY!
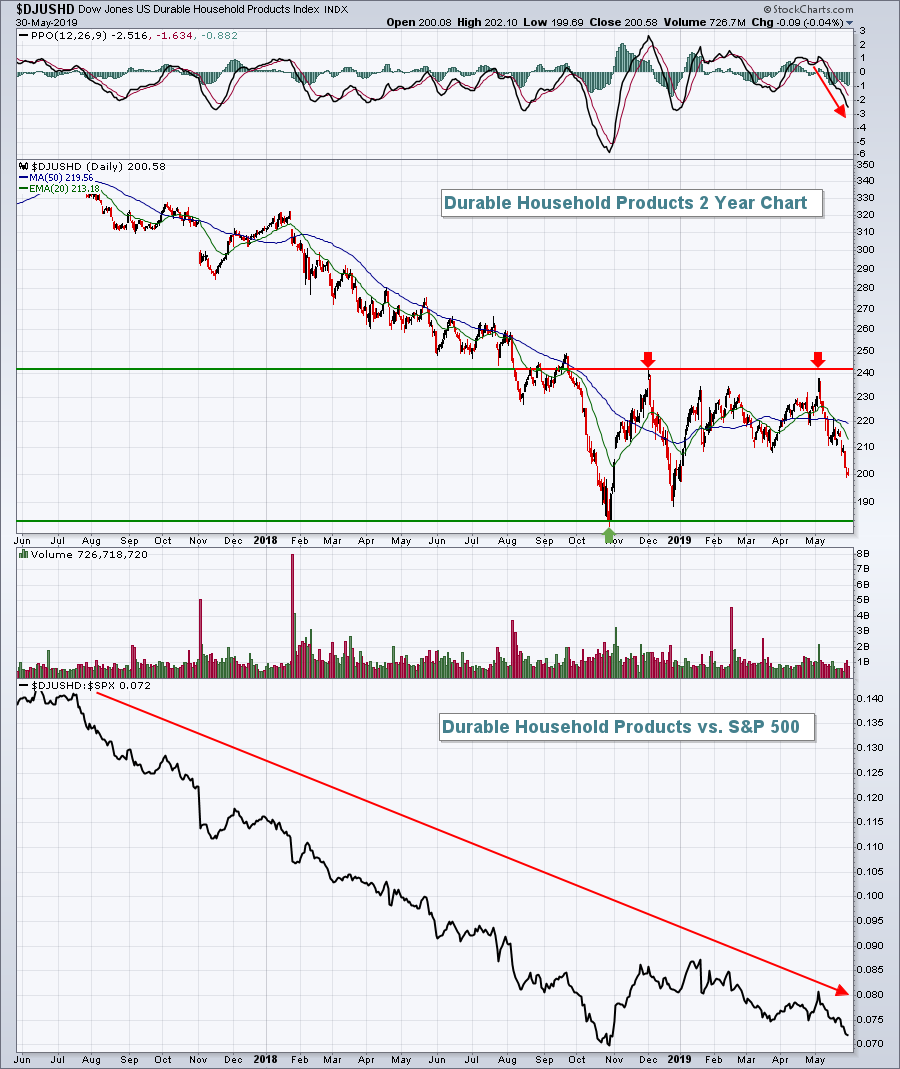 While there have been times (like November 2018) where the DJUSHD seemed to be making progress, but honestly it was nothing more than a relative bounce for the group. The DJUSHD remains one of the worst areas of the U.S. stock market to trade. I would not even consider this group until the 242-243 price resistance level is cleared and the relative downtrend is broken. In other words, there's a lot of work to do here.
Historical Tendencies
Fridays (+17% annualized return since 1950 on S&P 500) have historically been very strong days for the stock market and the 31st day of calendar months (+30.82% annualized return since 1950 on S&P 500) has been historically strong as well.
These two historical tendencies will be tested to the max today based on current futures.
Key Earnings Reports
None
Key Economic Reports
April personal income released at 8:30am EST: +0.5% (actual) vs. +0.3% (estimate)
April personal spending released at 8:30am EST: +0.3% (actual) vs. +0.2% (estimate)
May Chicago PMI to be released at 9:45am EST: 53.6 (estimate)
May consumer sentiment to be released at 10:00am EST: 101.5 (estimate)
Happy trading!
Tom
