Market Recap for Wednesday, May 29, 2019
Trade and growth concerns, along with slumping crude oil prices ($WTIC), were mostly responsible for another bad day on Wall Street. There was across-the-board selling as all of our major indices fell from 0.69% (S&P 500) to 0.94% (Russell 2000). It was the same in terms of sector performance as only materials (XLB, +0.02%) managed to close with a gain. Of the other 10 sectors, financials (XLF, -0.19%) showed relative strength despite another drop in the 10 year treasury yield ($TNX). The TNX did recover after noon and that likely sent buyers into the group, hoping for a near-term bottom. It also helped that crude oil recovered off of big losses earlier in the session as well. Energy (XLE, -0.64%) was an early laggard, but did recover some of its losses by days' end.
If there was a silver lining, it was that on a bad day the two worst sector performers were utilities (XLU, -1.33%) and real estate (XLRE, -1.15%), both defensive groups. In a worst case scenario of a lingering trade war with China and a potential recession ahead, I'd expect to see the market participants shedding the more aggressive stocks. That didn't occur on Wednesday and offered up a bit more hope for near-term action.
Pharmas ($DJUSPR, -1.94%) were roughed up a bit as Johnson & Johnson (JNJ, -4.19%) braced for the beginning of opioid trials that allege JNJ and other companies are responsible for thousands of opioid-related deaths. Retailers (XRT, -2.24%) can't catch a break as the May swoon continues:
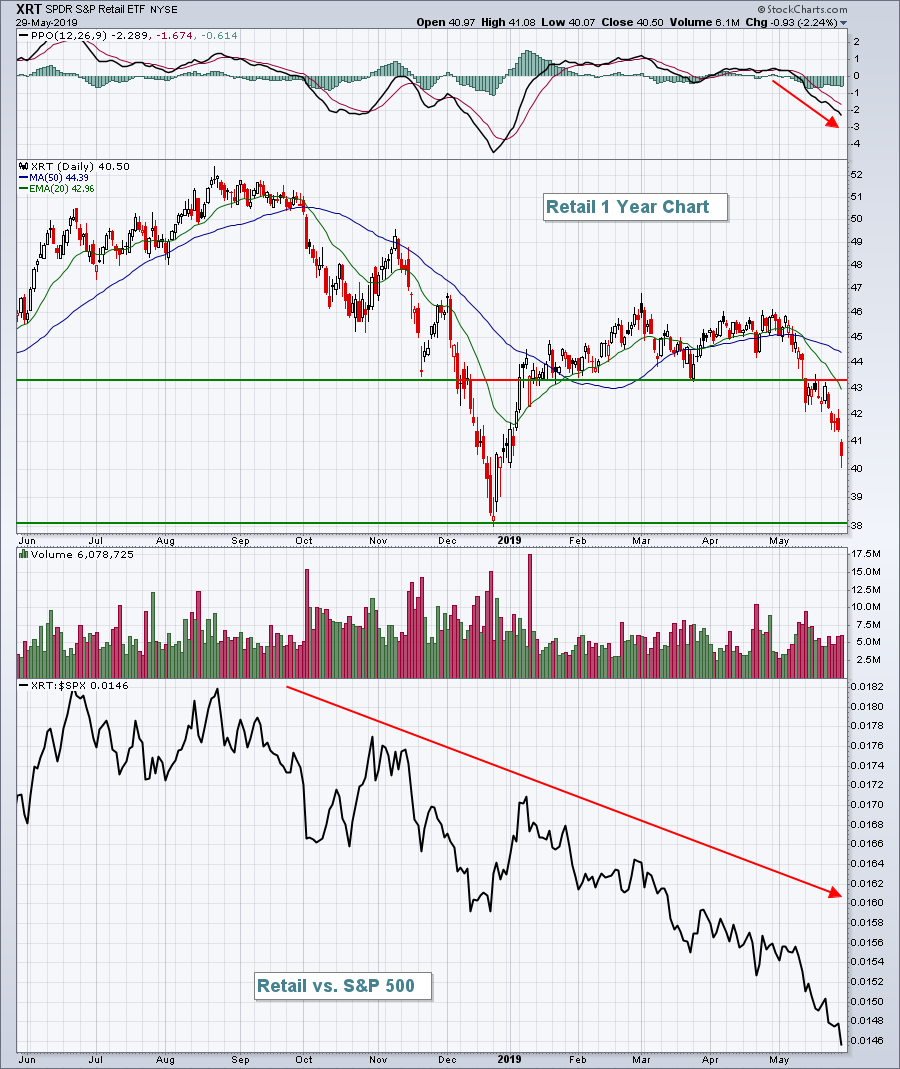 While the January and February recovery appeared solid, check out the relative strength chart at the bottom. With the exception of a few weeks to open 2019, the XRT has badly lagged the S&P 500. Yesterday, clothing & accessories ($DJUSCF, -3.48%) and footwear ($DJUSFT, -2.57%) were hit hard. Abercrombie & Fitch (ANF, -26.47%) lowered its outlook and Nike (NKE, -2.87%) sold off following its Tuesday technical breakdown.
Pre-Market Action
There was weakness overnight in Asia, though contained, while European markets are moving fractionally higher. U.S. indices look to recover a bit of recent losses at the opening bell as Dow Jones futures are higher by 54 points with a bit more than 30 minutes left to the opening bell.
There are two reasons for relief thus far. First, the 10 year treasury yield ($TNX) is up 2 basis points this morning, which equity investors are hoping represents an end to the significant decline we've seen throughout May. Secondly, crude oil prices ($WTIC) are slightly higher this morning after bouncing off $57 per barrel yesterday. That was the lowest reading on crude in over two months as traders worry that the drop in crude oil is directly associated with a weakening global economy.
Current Outlook
I write a lot about the Volatility Index ($VIX), but there's another sentiment indicator that can prove equally useful. It's the equity only put/call ratio ($CPCE). When this ratio rises, it means that there are more equity puts traded than equity calls. Of course, put buyers use leverage to profit from price declines. As this ratio moves higher and higher, it warns us of too much pessimism. Extreme sentiment readings tend to coincide with market tops and bottoms. The following chart represents a 5 day moving average of the put/call ratio:
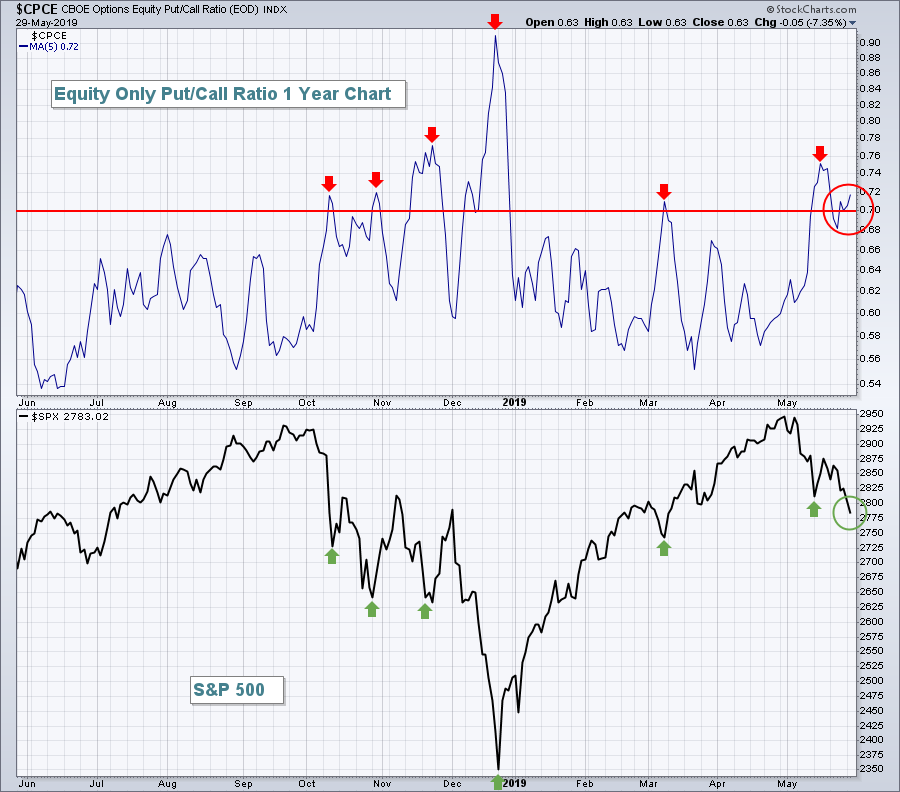 Before you grow overly short-term bearish, study the above chart. I don't know where the CPCE will top, but I do know it's elevated. Any 5 day moving average reading above .70 has signaled either that a top was at hand or rapidly approaching. While the headline news makes all of us squirm, if you truly want to move opposite the masses, it's time to begin accumulating.
Sector/Industry Watch
The S&P 500 opened this month with an all-time record intraday high of 2954. Yesterday, the SPX closed at 2783, a 171 point decline in roughly 4 weeks. Over the past month, there are only two industry groups non-gold-related that have managed to eke out gains. One is toys ($DJUSTY, +0.49%). The other is specialized consumer services ($DJUSCS, +1.49%). Despite all the trade war rhetoric and increased volatility, the DJUSCS has shown considerable relative strength through the ups and downs of 2019:
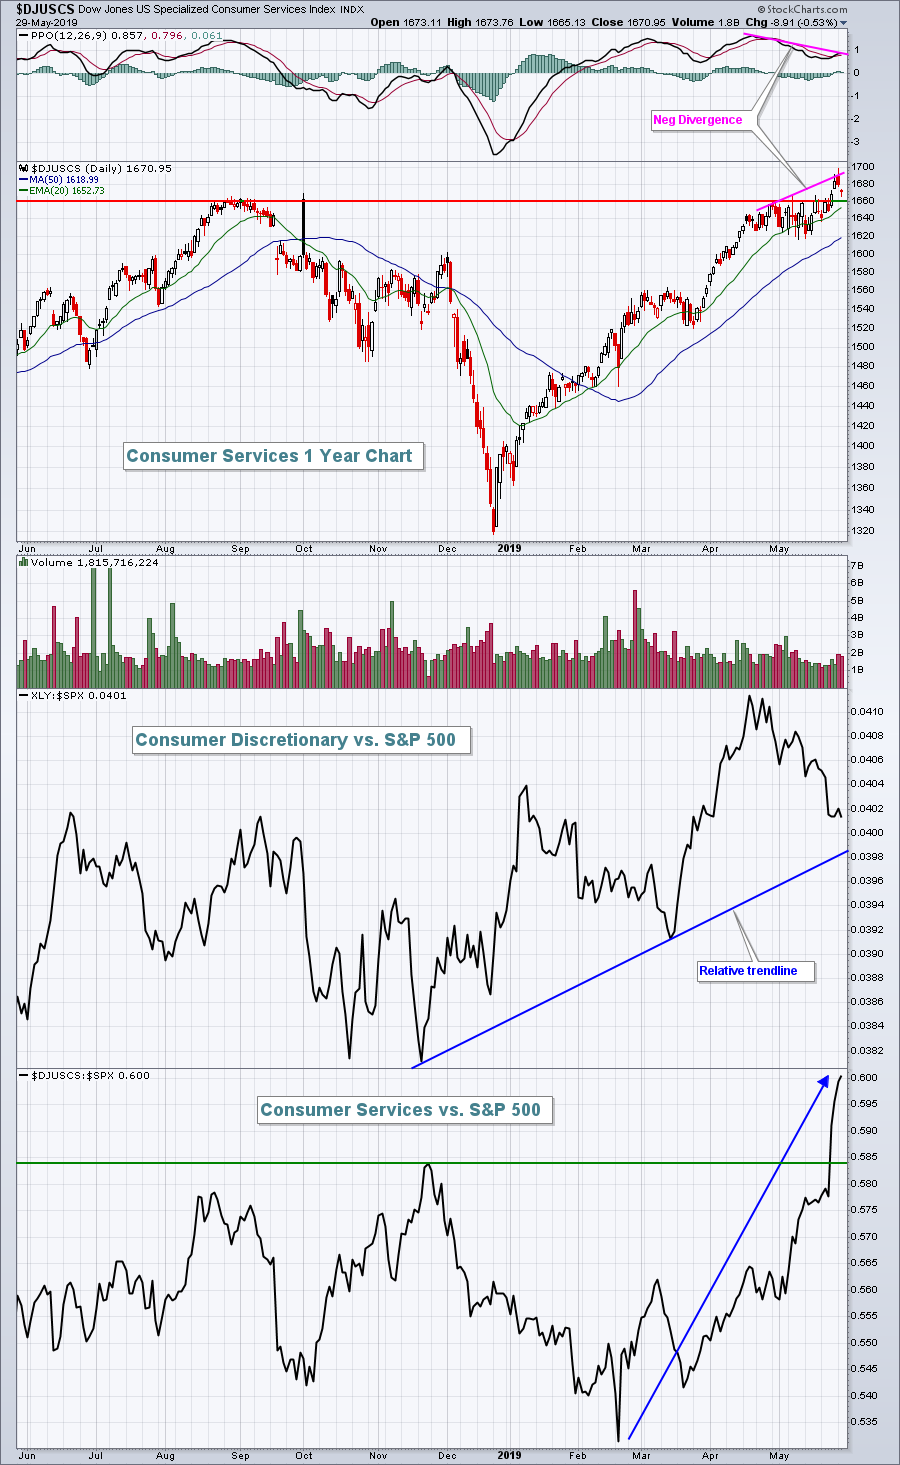 The negative divergence suggests we could see a bit of short-term weakness. A pause is the DJUSCS relative strength wouldn't necessarily be a bad thing. It might help to establish a base from where the group could launch higher again on a relative basis. The DJUSCS is part of consumer discretionary (XLY) and you can see that the discretionary sector as a whole has taken a month-long break. I look for the XLY's relative uptrend to resume, however, once this period of selling ends. If that's the case, don't overlook the DJUSCS - even if it does struggle as a result of short-term slowing momentum.
Historical Tendencies
Okta, Inc. (OKTA) is a software company ($DJUSSW) and we know how strong the group has been. If you've followed OKTA, you know it's a volatile stock, but one that's performed extremely well, rising from just below 42 at the December low to yesterday's close at 105.49. In short, it's a leader in software. OKTA reports its earnings after the bell today and I expect that they'll be quite strong given the technical picture and relative strength. But in order to continue its ascent, this 3 year old public company will need to do something it hasn't done since going public - rise in June and July:
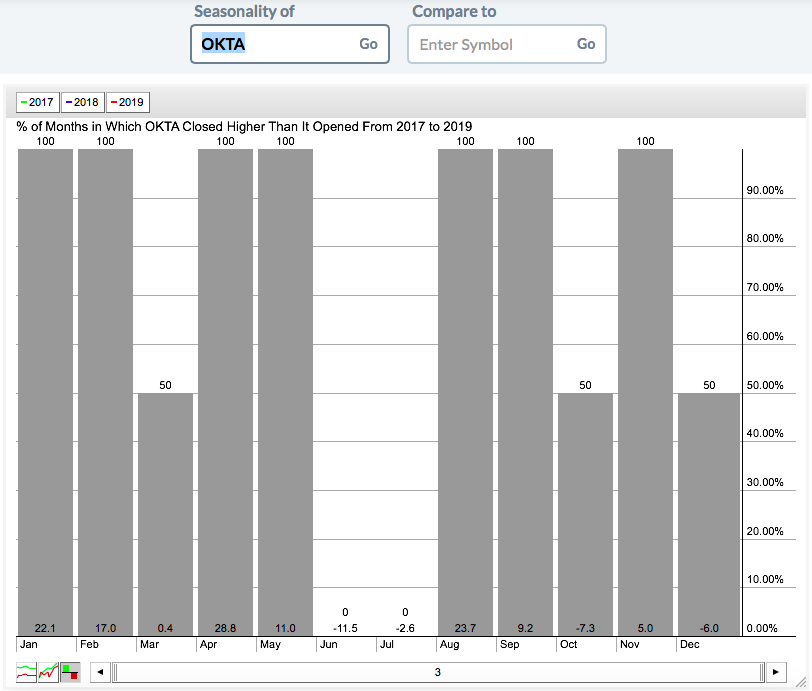 I know the company has a brief public history, but June and July stand out as the only calendar months where we haven't seen a single monthly gain in OKTA. Will that change in 2019 on the heels of tonight's earnings report? We'll soon find out.
Key Earnings Reports
(actual vs. estimate):
DG: 1.48 vs 1.39
DLTR: 1.14 vs 1.15
TECD: 2.04 vs 1.98
(reports after close, estimate provided):
COO: 2.76
COST: 1.83
DELL: 1.19
GPS: .31
MRVL: .15
NTNX: (.60)
OKTA: (.21)
ULTA: 3.06
VMW: 1.27
ZS: .01
Key Economic Reports
Q1 GDP (2nd estimate) released at 8:30am EST: 3.1% (actual) vs. 3.0% (estimate)
Initial jobless claims released at 8:30am EST: 215,000 (actual) vs. 215,000 (estimate)
April wholesale inventories released at 8:30am EST: +0.7% (actual) vs. +0.3% (estimate)
April pending home sales to be released at 10:00am EST: +0.5% (estimate)
Happy trading!
Tom
