Market Recap for Friday, June 7, 2019
U.S. indices capped off a very solid week with more gains on Friday. The more aggressive NASDAQ trounced the other key indices, climbing 1.66%. The S&P 500, Dow Jones, and Russell 2000 added 1.05%, 1.02%, and 0.72%, respectively. 9 of 11 sectors participated to the upside with three key groups - technology (XLK, +1.86%), communication services (XLC, +1.62%), and consumer discretionary (XLY, +1.45%) - leading the charge. Computer hardware ($DJUSCR, +2.31%) is strengthening again after bouncing off both February price and relative support:
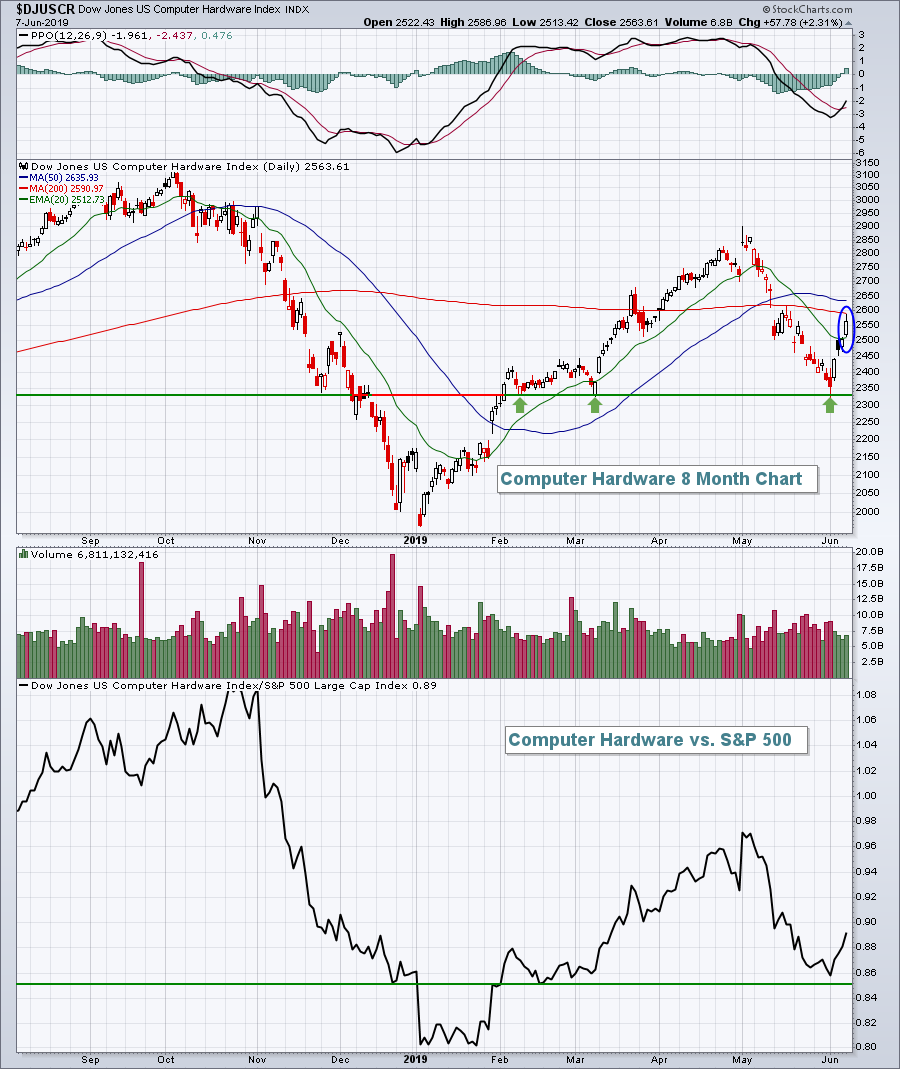 Keep an eye on both of the above support lines. I believe the odds of a significant market decline increase by a big margin if a key group like computer hardware fails to hold both absolute and relative price support.
Companies like Apple (AAPL, +2.66%), Alphabet (GOOGL, +1.97%) and Microsoft (MSFT, +2.80%) aided the rally in aggressive areas of the market. MSFT ended last week with a market capitalization above $1 trillion, easily outdistancing itself from AAPL, GOOGL and Amazon.com (AMZN, +2.83%). Wall Street is making a statement about MSFT and we should all be listening. It's a must own for now given its strength in the very bullish software space ($DJUSSW, +2.12%).
Utilities (XLU, -0.74%) and financials (XLF, -0.15%) failed to participate in Friday's rally. The latter no doubt continues to struggle because of the drop in the 10 year treasury yield ($TNX) since October 2018.
Pre-Market Action
Futures are pointing higher as the Dow Jones looks to extend last week's rally. Dow Jones futures are higher by 119 points as traders absorb two large mergers. Raytheon (RTN) and United Technologies (UTX) agreed to combine over the weekend as did Salesforce.com (CRM) and Tableau Software (DATA).
China's Shanghai Composite ($SSEC, +0.86%) rallied to test overhead price resistance at 2850. The SSEC has been underperforming most global markets over the past 6-7 weeks, since topping in April.
Current Outlook
Semiconductors ($DJUSSC, +1.28%) jumped back above its 20 day EMA on Friday, which is very noteworthy because the group managed to hold relative support established during Q4 2018 and is now beginning to show relative strength again. While I won't say that continuing relative strength in the DJUSSC is a "must" for the market to resume its 2019 rally, it most definitely would be a welcome development for the bulls:
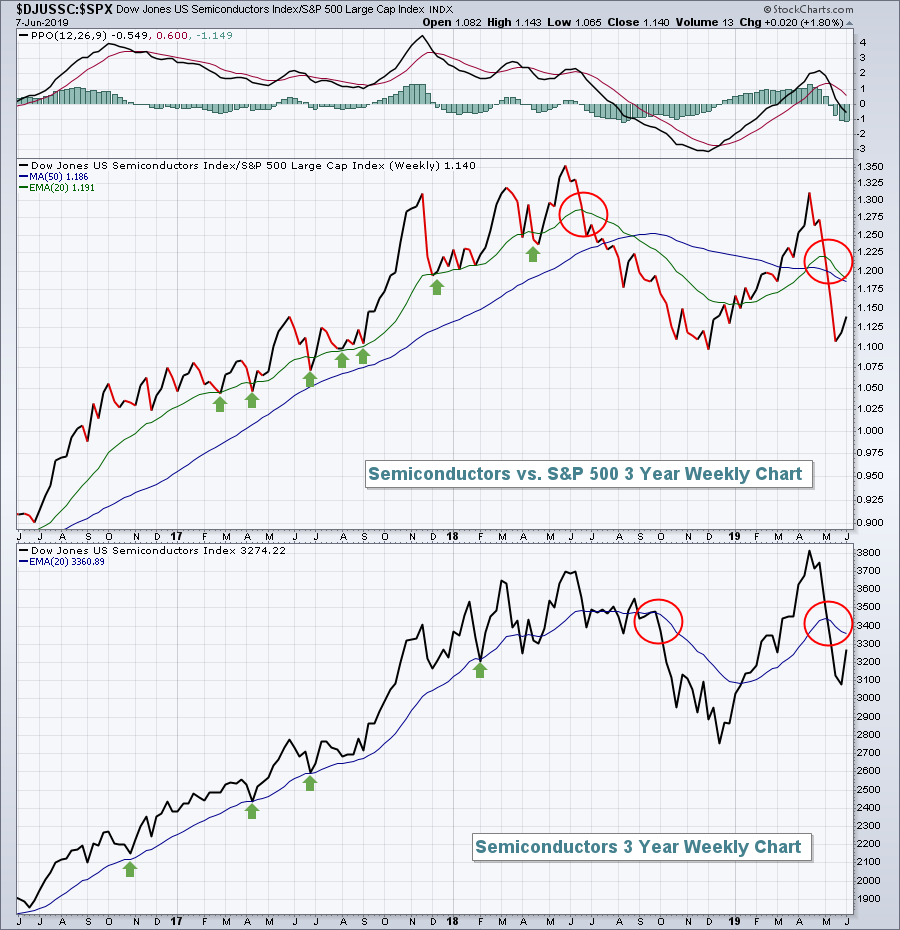 The green arrows highlight the strength in semiconductors throughout 2017 into early 2018. When the semiconductors were rolling higher, so too was the overall market. But the red circles illustrate the real importance of semiconductors. When this group lost both its absolute and relative strength, we saw significant deterioration in our major indices. Earlier, I mentioned that the DJUSSC closed above its 20 day EMA on Friday, but it's still got some work to do to clear its 20 week EMA. Such a move would add to the bullishness in the overall market and is a development that I'd keep a very close eye on.
Today, after the closing bell, I am going to highlight the best and worst industry groups relative to the S&P 500 in a webinar hosted by EarningsBeats.com, "The Power of Relative Strength". Relative strength is at the heart of my strategy in selecting my Model Portfolio every quarter. I began publicly tracking my Model Portfolio on November 19, 2018, just before the December meltdown and it's returned +39.69% since that date (less than 7 months). The S&P 500, by contrast, has gained +6.79% over the same time period. I attribute this massive outperformance to relative strength. This Model Portfolio only owns stocks exhibiting relative strength vs. its peers, while its peers exhibit relative strength vs. the S&P 500. In other words, the portfolio is filled with companies that are "best of the best".
I'll discuss the characteristics that I look for in selecting these Model Portfolio stocks during the webinar and would love to have you join me. To join me, follow this link for more information and to register.
Sector/Industry Watch
The Dow Jones U.S. Drug Retail Index ($DJUSRD) has been a train wreck since early December 2018 as the group is down a third from that high, significantly underperforming the benchmark S&P 500. It exemplifies the importance of steering clear of areas hurt by sector and industry rotation. There is potentially good short-term news, however. First, check out the apparent slowing downside momentum (positive divergence) below:
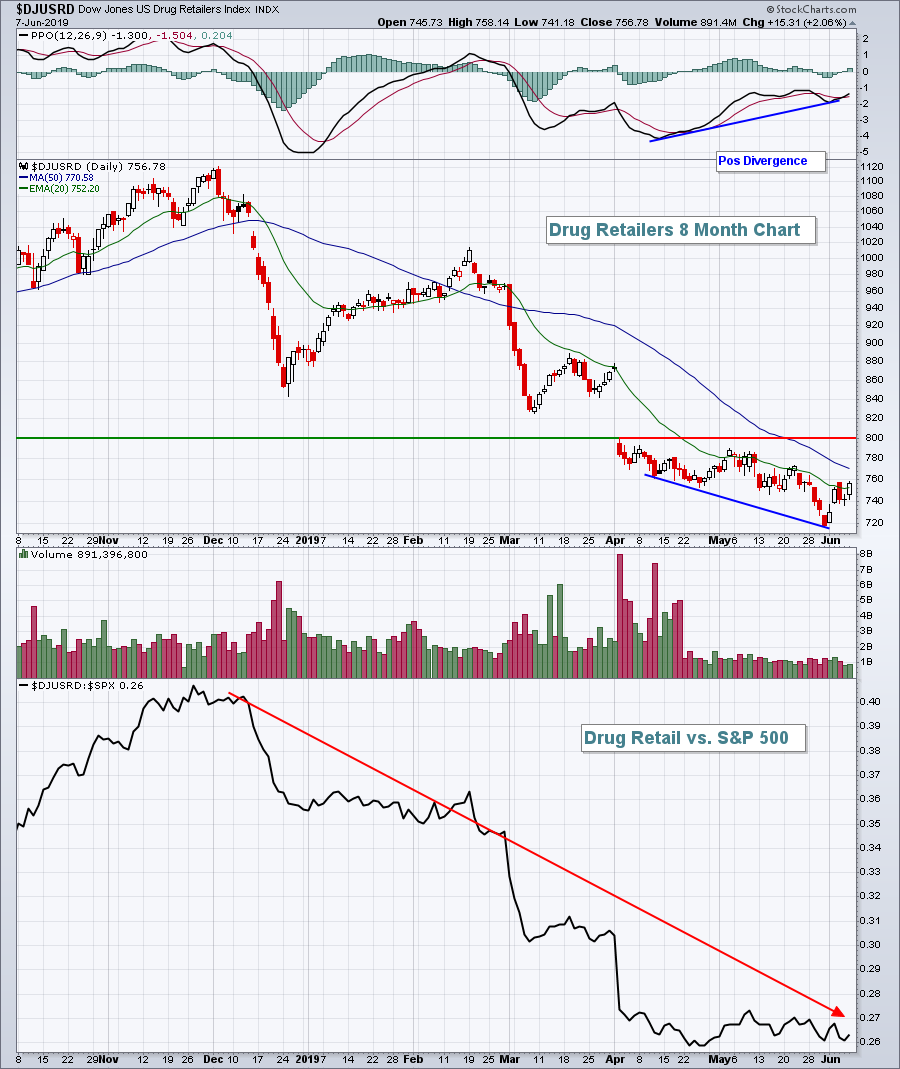 It's quite possible that we've seen a 2019 low, although I would definitely respect this chart if we see another breakdown. In addition to the technical signal that the worst could be behind the group, check out the Historical Tendencies section below. The DJUSRD most definitely prefers the second half of calendar years historically.
Monday Setups
Ollie's Bargain Outlook Holdings (OLLI) reported strong earnings late last week and initially sold off hard, but rebounded to print a doji (reversing candle) on its 50 day SMA. I'm looking for strength off of that action:
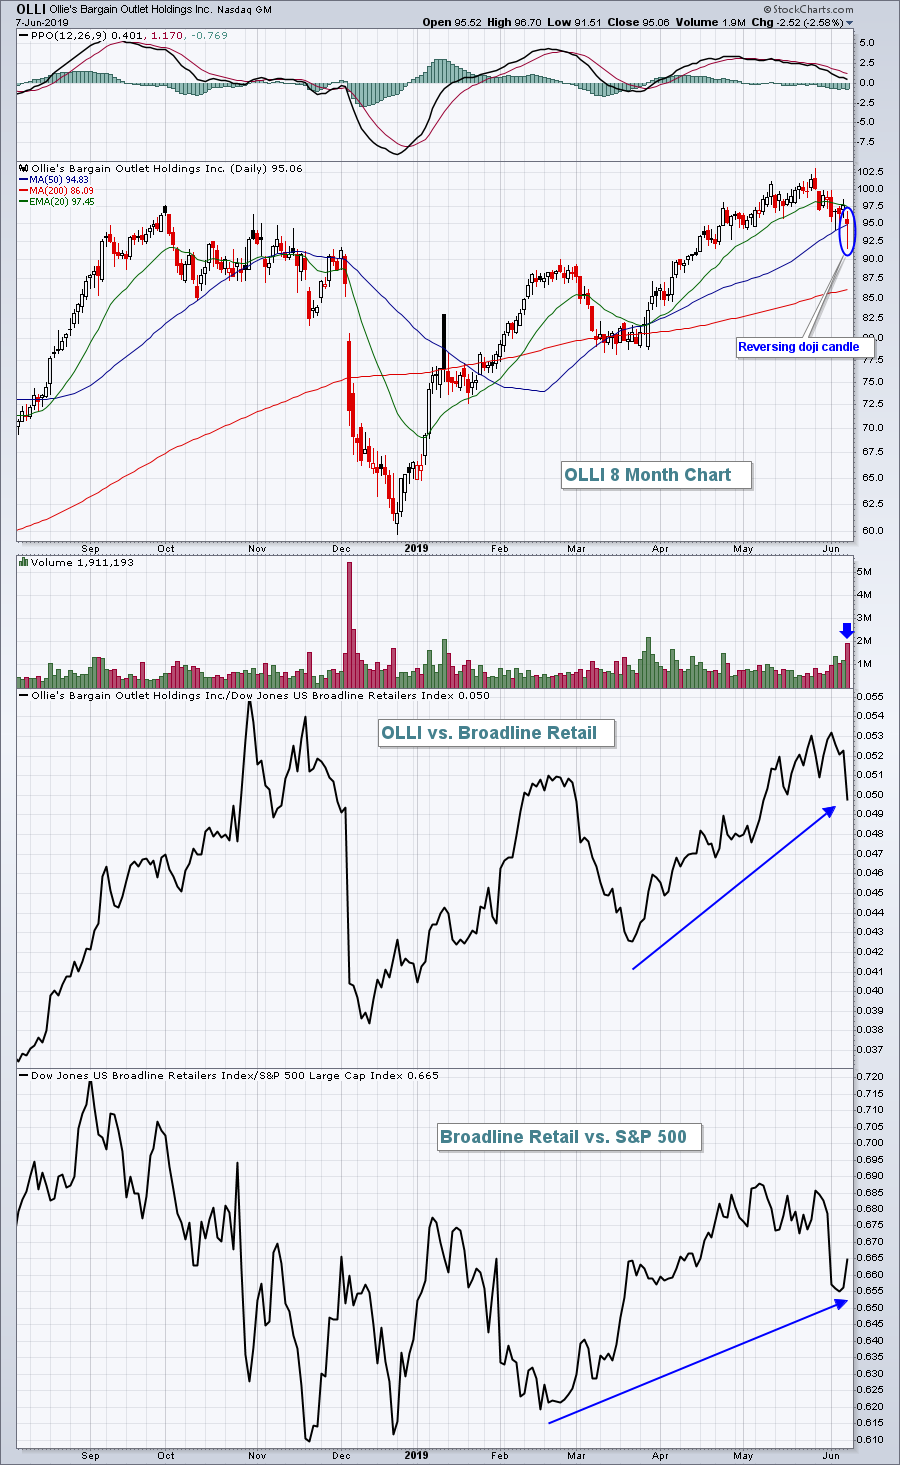 Broadline Retail ($DJUSRB) has begun to strengthen once again relative to the benchmark S&P 500 in June and OLLI has been a bright spot in that industry group. I prefer trading stocks showing relative strength. I'd simply keep an intraday stop beneath Friday's low.
I have two additional trade candidates this week. You can review those charts by CLICKING HERE.
Historical Tendencies
Walgreens Boots Alliance (WBA) is part of the very weak drug retail area ($DJUSRD), but there's a positive divergence in the group as reflected above in the Sector/Industry Watch section, and WBA likes the upcoming month of July:
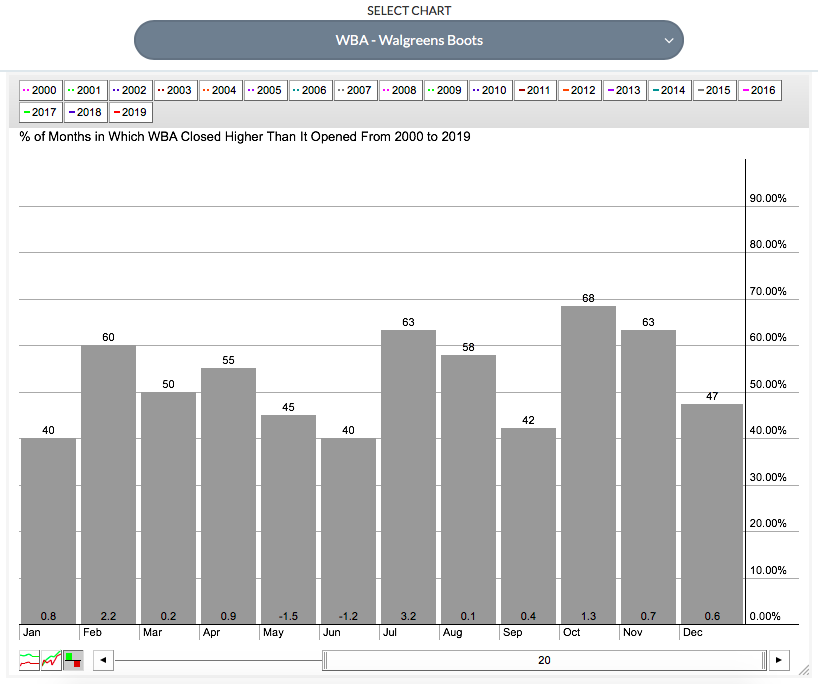 The average return in July of 3.2% is WBA's best among the calendar months and it's risen close to two-thirds of all Julys this century. Furthermore, WBA's average return from January through June is +1.4%. The July through December period, however, has produced average returns of +6.3%. WBA seems to enjoy the second half of the calendar year.
Key Earnings Reports
(reports after close, estimate provided):
CASY: .42
Key Economic Reports
None
Happy trading!
Tom
