Market Recap for Monday, June 3, 2019
I've had lots of positives for software stocks the past few years, but yesterday we saw a rare short-term breakdown that will test the mettle of traders. The Dow Jones U.S. Software Index ($DJUSSW, -3.17%) joined internet stocks ($DJUSNS, -6.23%) to lead a stampede of selling in the high octane growth stocks found on the NASDAQ 100 ($NDX, -2.10%) and that's always a bit unnerving as many of those stocks rely on big earnings growth. As more and more discussion revolves around trade concerns and a possible global recession, traders tend to shun equities in general, but particularly high growth companies. The Volatility Index - CBOE Nasdaq 100 ($VXN) approached an important level at the close yesterday:
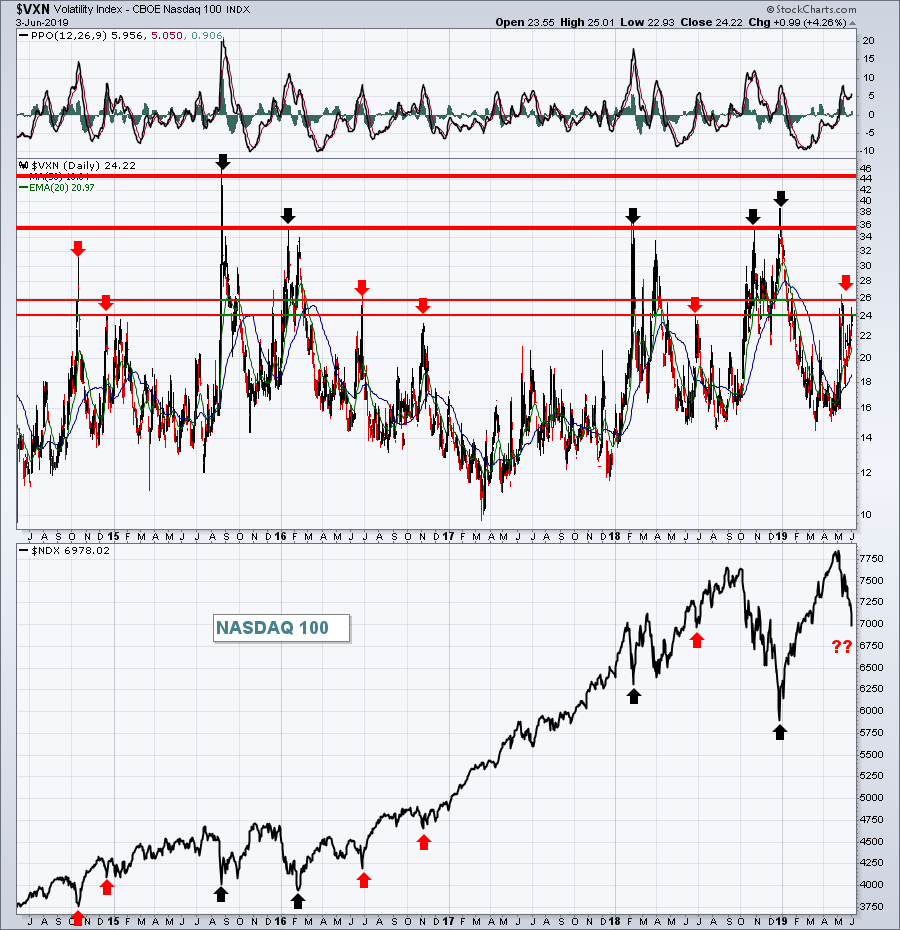 The black arrows above show the deeper periods of selling where the VXN tends to top out in the 35-45 range. The red arrows are mostly associated with correction-type selling. If the VXN breaks above 26-27, we could see selling escalate quickly with more 3-4% daily losses. Those days can be extremely painful so today and the balance of this week will be a test for the bulls for sure.
While the NASDAQ had a very rough day, there was actually mostly buying, especially in the final 20 minutes or so when the S&P 500 erased two-thirds of its losses. Materials (XLB, +3.15%) and energy (XLE, +1.28%) benefited from a second day of selling in the U.S. Dollar Index ($USD, -0.62%). Consumer staples (XLP, +1.26%) and utilities (XLU, +1.00%) also were strong as weak growth stocks pushed traders into the safer defensive sectors.
Pre-Market Action
Crude oil ($WTIC) has dropped approximately 15% in the past couple weeks on very heavy volume and it's not getting any relief this morning as crude is down another .77% to $52.84 per barrel at last check. Energy stocks (XLE) got a boost yesterday from a falling dollar, but it could really use a reversal in the trend of crude oil prices.
The 10 year treasury yield ($TNX) is up 4 basis points to 2.12% as traders sell treasuries for the first time in awhile. Should that continue, we could see a very nice rebound in U.S. equities.
Overnight, the China Shanghai Composite ($SSEC, -0.96%) fell to approach a very important short-term price support level at 2850. It closed at 2862. European markets are nicely higher with the German DAX ($DAX) up by more than 1.2% at last check.
With an hour left to the opening bell, Dow Jones futures are higher by 165 points.
Current Outlook
The U.S. Dollar Index ($USD) closed yesterday at a 6 week low, prompting buyers in gold ($GOLD). Given the current state of technicals, I suspect we'll see more buying short-term in GOLD, although the longer-term is very suspicious unless the USD were to make a break of long-term trendline support:
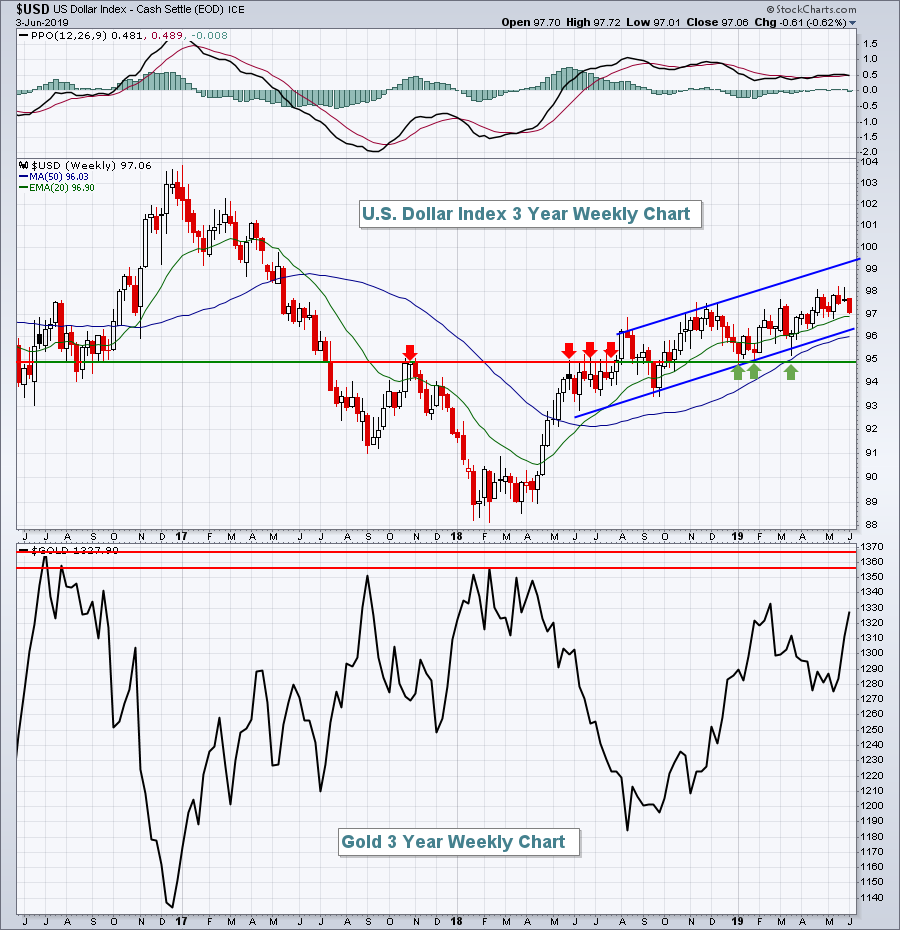 The trendline/channel shown above is short-term in nature. The longer-term trendline on the USD currently intersects the 92 level. Until that longer-term trendline is cleared to the downside, I will mostly avoid gold. Since the 2011 bottom in the USD, gold has outperformed the benchmark S&P 500 on only three distinct periods. The first was the late-2015 to early-2016 period of equity market turmoil. The second was the rapid Q4 2018 selloff in U.S. equites and the third is coinciding with the current period of stock market selling. When the stock market stabilizes, I fully expect we'll see continuing underperformance of gold relative to the S&P 500. Here's the visual:
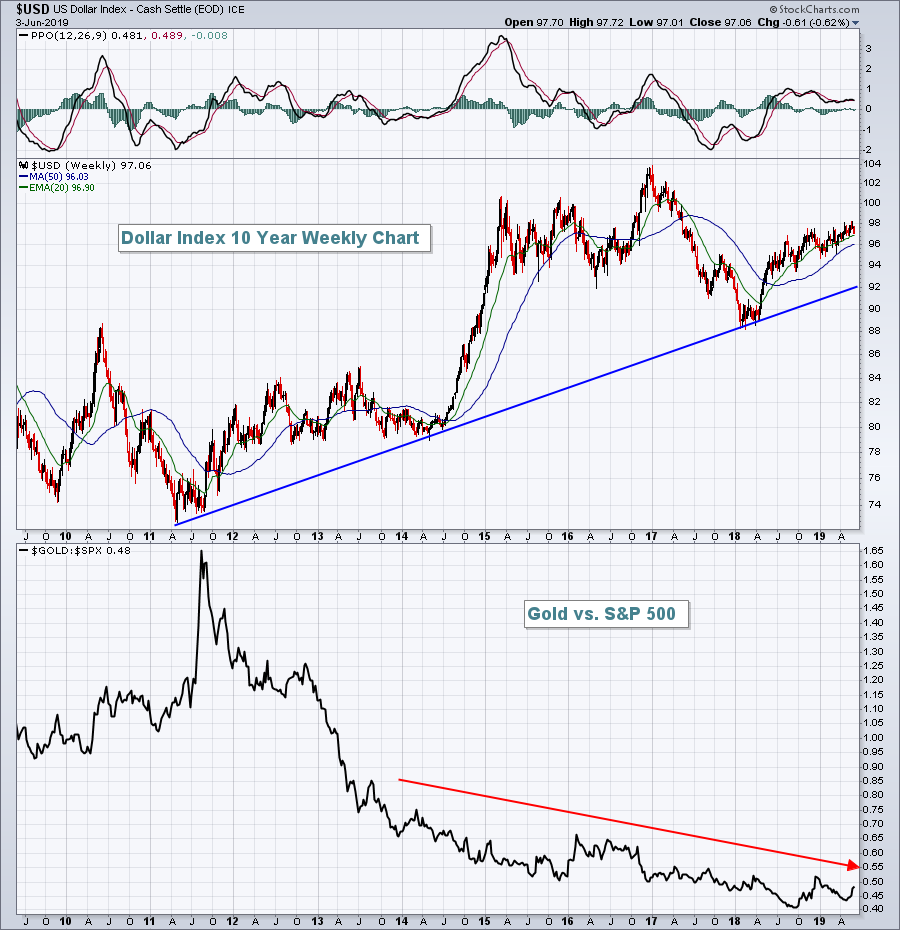 Given the 8 year uptrend in the USD, do you really want to try to outperform the benchmark S&P 500 with gold? Wait for a long-term breakdown in the USD before committing to a gold trade.
Sector/Industry Watch
I mentioned the weakness in software shares ($DJUSSW) earlier, but here's the picture:
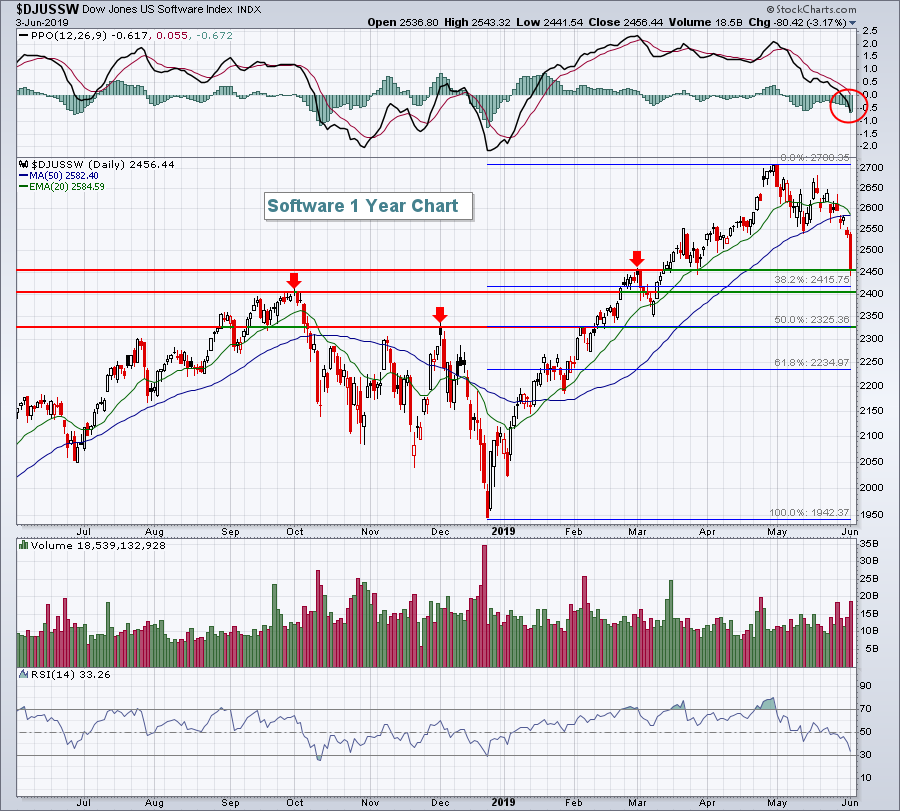 The heavy volume that accompanied the recent price breakdown beneath 2550 and the loss of the 50 day SMA was certainly a giant negative. The problem now with software is that those who bought at or near recent highs will be emotionally-charged and likely capitulate at exactly the wrong time - similar to the selling we saw in Q4. The timing of that capitulation will be difficult and if you're off by a day or two, it can be very painful. I've marked three support levels above to watch for potential reversing candles. Note that the final price support level of 2325 coincides exactly with the 50% Fibonacci retracement level. Loss of 2325 would be quite significant, so that is a level I'd monitor closely.
Historical Tendencies
Salesforce.com (CRM) reports its latest quarterly results after the bell tonight. It's been one of the worst performing software stocks despite the fact it's been mostly consolidating the past few months. However, recently it broke down beneath its consolidation range and June is the only calendar month where CRM has produced negative monthly returns over the past 16 years:
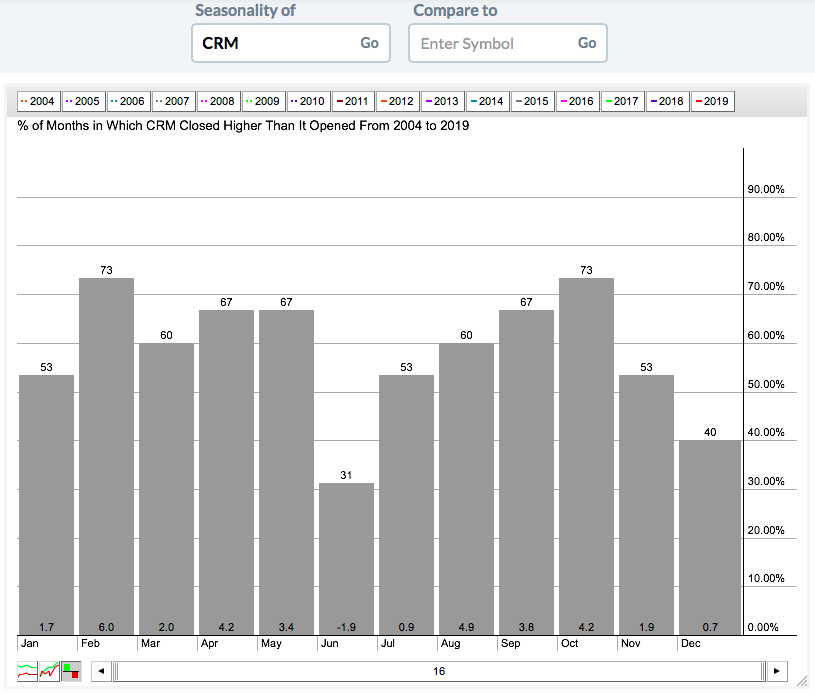 Wall Street is already predicting a not-so-great report later today. If that's the case, don't expect any seasonal love for CRM.
Key Earnings Reports
(actual vs. estimate):
DCI: .58 vs .62
TIF: 1.03 vs 1.01
(reports after close, estimate provided):
CRM: .61
GWRE: .08
PVTL: (.05)
Key Economic Reports
April factory orders to be released at 10:00am EST: -0.8% (estimate)
Happy trading!
Tom
