Special Note
I will be joining John Hopkins of EarningsBeats.com for a webinar on Monday, July 29th after the bell. It's the quarterly earnings webinar where I'll point out some of the biggest winners of earnings season to date. Those will be stocks that you want to keep on your radar to trade the next few months as they'll be not only stocks producing great fundamentals, but also stocks showing excellent relative strength. That's what drives the performance of my portfolios, which are crushing the S&P 500.
Speaking of those portfolios, I will also be announcing the 10 stocks to be included in each of my portfolios at an August 19th webinar at EarningsBeats.com. If you take out a 30-day TRIAL subscription for just $7, you'll be able to attend both of these webinars, which I promise will change your investing/trading results for the better.
CLICK HERE for more information. Thanks and I hope you'll join me!
Market Recap for Wednesday, July 24, 2019
Several notable companies, including Texas Instruments (TXN, +7.4%), Northrop Grumman (NOC, +5.9%), and United Parcel Service (UPS, +8.7%), took big leaps after reporting their latest quarterly earnings and that lifted the S&P 500 ($SPX, +0.47%) and NASDAQ ($COMPQ, +0.85%) to new all-time highs. The Russell 2000 ($RUT, +1.64%) actually outperformed on the session in a rather rare occurrence of late. The Dow Jones ($INDU, -0.29%), however, rallied back from earlier losses, but still failed to break into positive territory. While earnings were generally quite strong and responsible for a very good day on Wall Street, two Dow components disappointed. Boeing (BA, -3.12%) and Caterpillar (CAT, -4.48%) weighed on the Dow after releasing their reports. BA beat on both its top and bottom lines, but failed to provide guidance for the second straight quarter and also announced a delay in its first flight target date for its 777X plane to early 2020. That didn't impress traders. CAT, on the other hand, just had a bad report. They fell short of revenue and earnings estimates, lowered guidance and failed to provide anything positive for traders. Honestly, I wouldn't have expected anything different from these two based on how they were trading among their peers heading into their results:
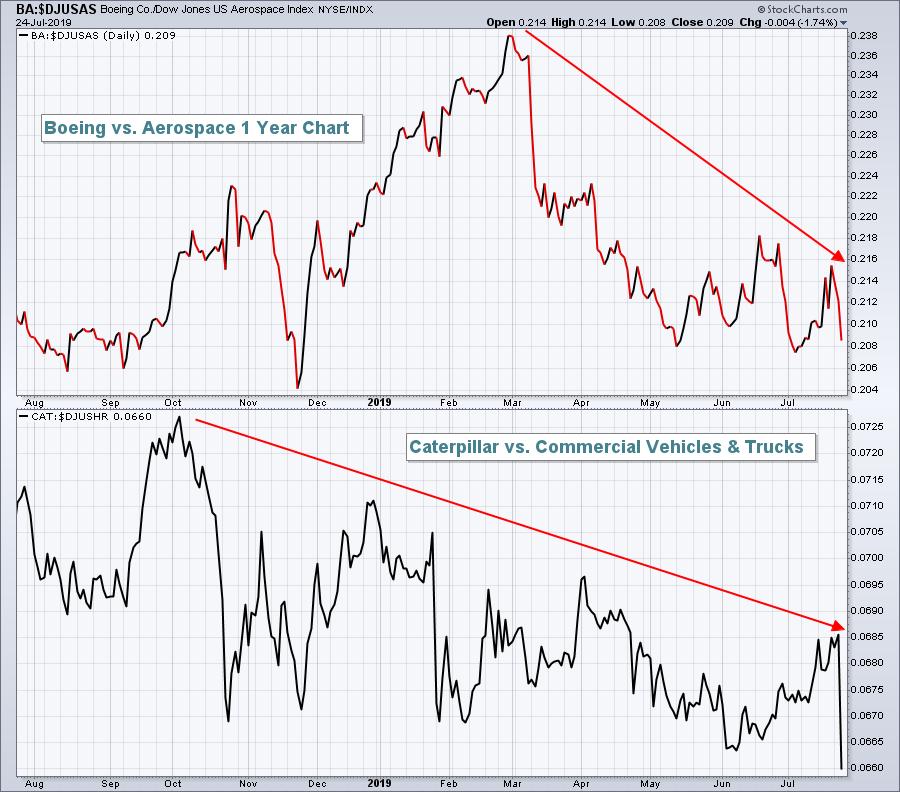
This helps to explain the importance of following relative strength. Wall Street knew there were problems and they avoided these two on a relative basis. Negative reactions to earnings reports are not random events. We get warnings every single day. You have to learn to heed them.
Despite a very strong showing from semiconductors ($DJUSSC, +3.01%) and software ($DJUSSW, +1.28%), technology (XLK, +0.83%) still trailed both financials (XLF, +1.03%) and communication services (XLC, +0.88%) from a sector perspective. Banks ($DJUSBK, +1.42%) had another strong session and broke to its highest close since October 2018, a bullish development for U.S. equities. More on banks in the Sector/Industry Watch section below.
Pre-Market Action
Crude oil ($WTIC) is up 1.75% this morning as it nears $57 per barrel. Let's keep an eye on that elusive $60 per barrel level. A break above that would represent the potential of strengthening global demand, a bullish signal for global equities.
Dow Jones futures are up roughly 100 points as the European Central Bank (ECB) has indicated that they'll be easing monetary policy. That should, in turn, help the U.S. Dollar Index ($USD), which already looks bullish technically, breaking out of an inverse head & shoulders pattern on Tuesday.
Current Outlook
I'm continuing to watch the transports ($TRAN, +0.54%) very closely. Truckers ($DJUSTK, +1.24%) have now risen approximately 14% over the past two weeks and that's enabled the TRAN to establish a clear short-term uptrend, with 20 day EMA support holding:
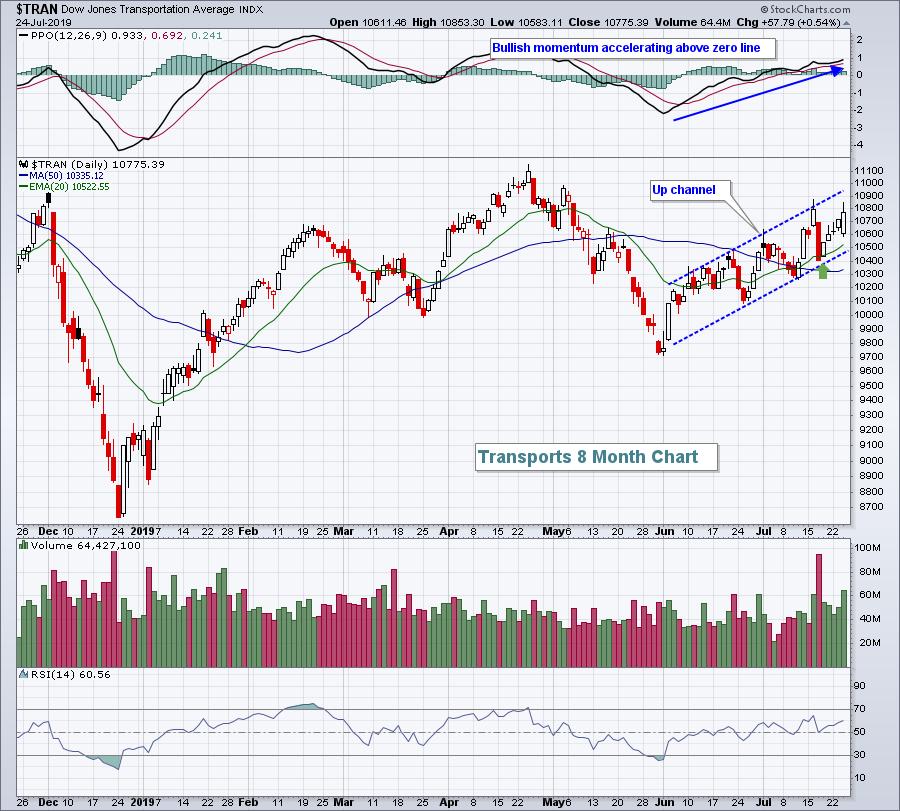
Note the volume has increased on this latest rise, which is indicative of Wall Street accumulation. Transports are looking as bullish as they have at any point since February 2019.
Sector/Industry Watch
The Dow Jones U.S. Banks Index ($DJUSBK, +1.42%) is strengthening on an absolute basis, but hasn't really done so on a relative basis. I don't look to banks to lead the market higher, but I do want the group to participate. We're a credit-driven society so it's very important to have a healthy banking industry to support the accelerating revenue and earnings growth that drives bull markets higher. Here's the current view of the DJUSBK:
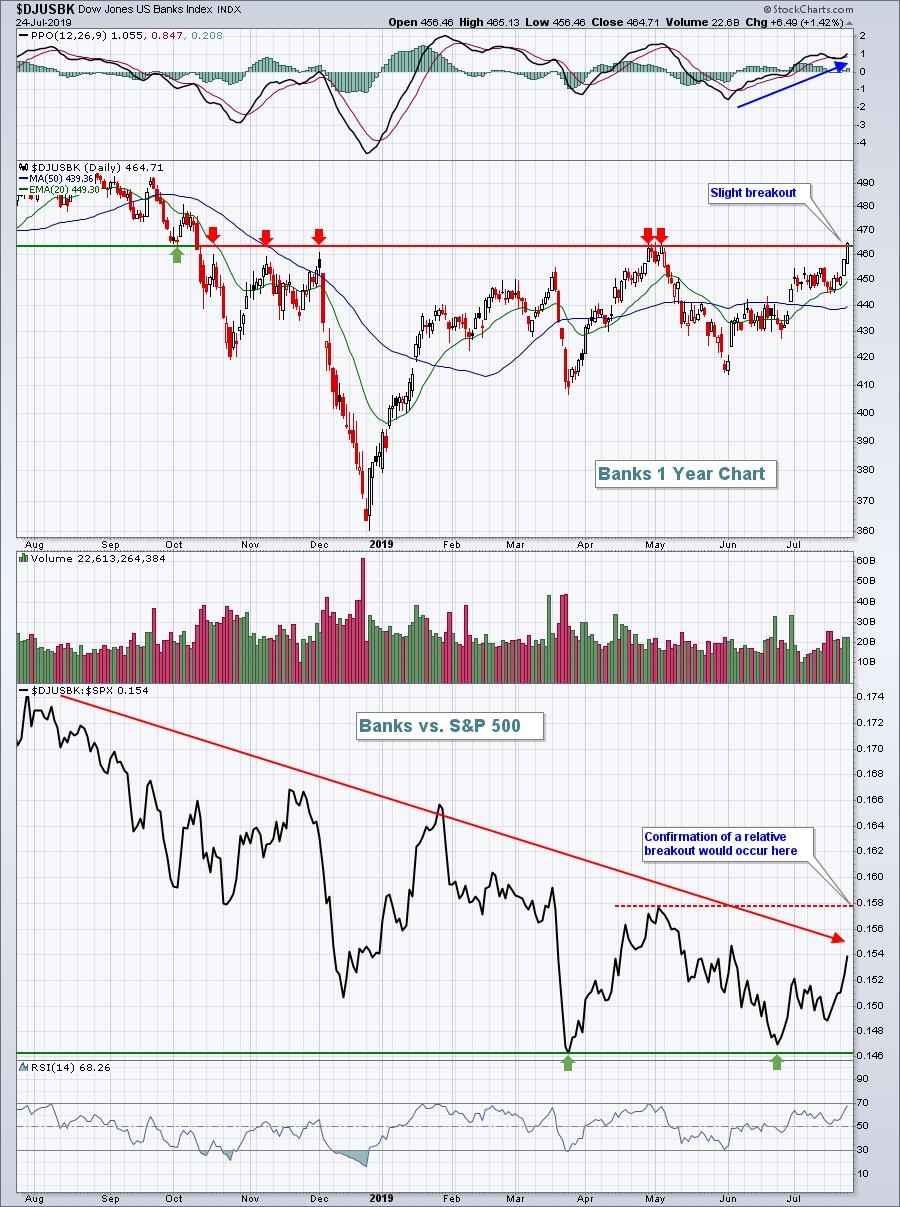
The absolute breakout is definitely bullish, especially if it's confirmed by further strength over the next few days. But we won't see a relative breakout until the $DJUSBK:$SPX ratio moves above the early-May high near 0.158. That would likely spur a major move higher in U.S. equities.
Historical Tendencies
Biogen, Inc. (BIIB) is a stock to watch. It closed on Tuesday at its highest level since the massive gap lower back in March. The renewed strength comes in July, at a time when it generally sees historical bullishness:
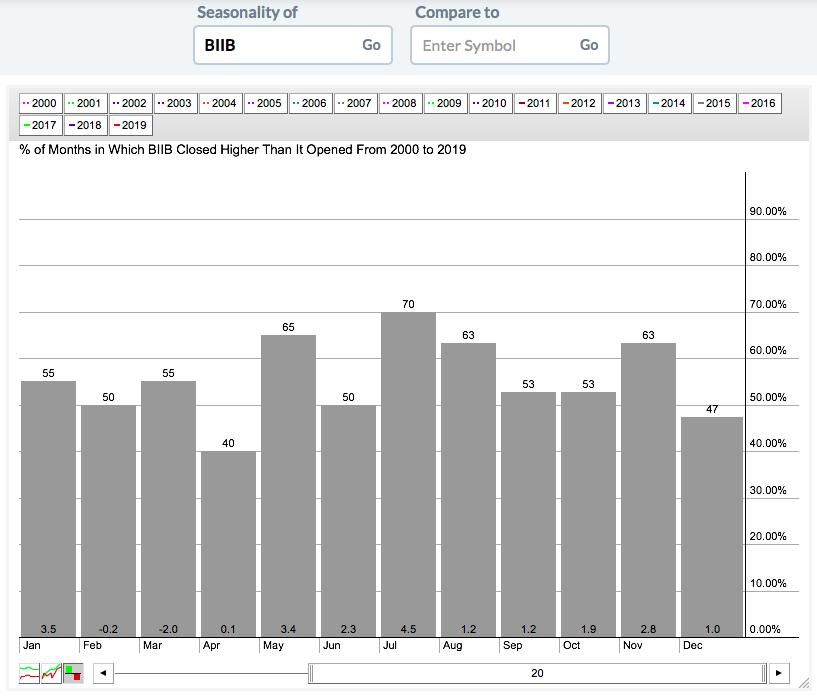
Not only is July its best calendar month of the year, it also triggers its better half year. BIIB has produced average gains the past 20 years as follows:
1st half of year: +12.6%
2nd half of year: +7.1%
Key Earnings Reports
(actual vs. estimate):
AAL: 1.82 vs 1.77
ABB: .34 vs .26
ABEV: .04 vs .04
AEP: 1.00 vs .98
APD: 2.17 vs 2.14
AZN: .73 vs .30
BAX: .89 vs .81
BMY: 1.18 vs 1.06
BUD: 1.25 vs 1.13
CMCSA: .78 vs .75
CMS: .33 vs .44
FDC: .42 vs .41
HBAN: .33 vs .32
HSY: 1.31 vs 1.13
IP: 1.15 vs 1.01
KKR: .39 vs .34
LH: 2.93 vs 2.90
LUV: 1.37 vs 1.35
MAS: .88 vs .81
MMM: 2.20 vs 2.04
NEM: .12 vs .23
NOK: .06 vs .01
ODFL: 2.16 vs 2.11
RCL: 2.54 vs 2.45
ROK: 2.40 vs 2.29
ROP: 3.07 vs 3.04
RTN: 2.92 vs 2.61
STM: .18 vs .20
TAL: .03 vs .13
TECK: .60 vs .64
TMUS: .99 - estimate, awaiting results
TOT: 1.05 vs 1.23
TSCO: 1.80 vs 1.81
VLO: 1.51 vs 1.37
VMC: 1.48 vs 1.45
WM: 1.11 vs 1.07
(reports after close, estimate provided):
AFL: 1.07
AJG: .61
AMZN: 5.29
CPT: 1.27
EIX: 1.15
EMN: 2.09
ERIE: 1.64
EXPE: 1.70
FISV: .80
FMX: .80
FTV: .89
GOOGL: 11.50
IEX: 1.49
INTC: .89
JNPR: .40
LYV: .39
MGM: 1.25
MHK: 2.87
PFG: 1.40
RMD: .92
RSG: .78
SBUX: .72
SIVB: 4.98
SYK: 1.93
TEAM: .16
UHS: 2.49
VRSN: 1.29
Key Economic Reports
Initial jobless claims released at 8:30am EST: 206,000 (actual) vs. 219,000 (estimate)
June durable goods released at 8:30am EST: +2.0% (actual) vs. +0.5% (estimate)
June durable goods ex-transports released at 8:30am EST: +1.2% (actual) vs +0.2% (estimate)
June wholesale inventories released at 8:30am EST: +0.2% (actual) vs. +0.3% (estimate)
Happy trading!
Tom
