Market Recap for Tuesday, July 30, 2019
For a second straight day, traders opted for safety ahead of today's FOMC policy statement. It was once again apparent in the sector leaderboard, which ended the session on Tuesday as follows:
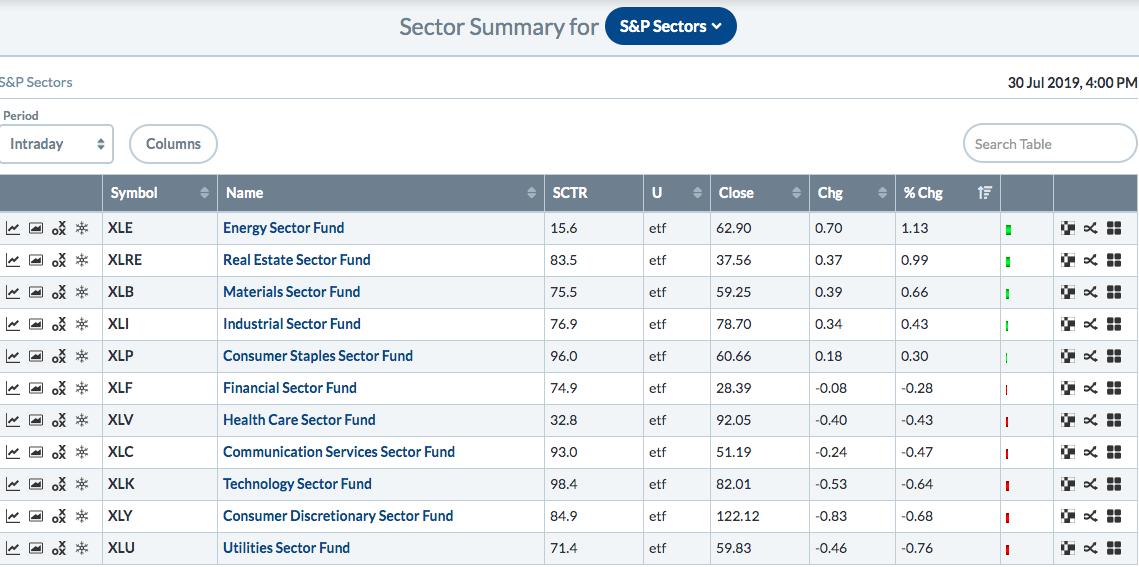
Industrials (XLI, +0.43%) became the first aggressive sector this week to end a day in positive territory. Consumer discretionary (XLY, -0.68%) and technology (XLK, -0.64%) were near the bottom of the list again as traders show their skittishness ahead of the Fed's decision. I can't blame them. We saw what happened in Q4 2018 and in April/May 2019 when the Fed ignored the bond market's directives. I'm not saying that our financial markets should sway the Fed, but ummmm yes the Fed should pay attention to what the bond market is saying. I've always said it's the smartest market, way smarter than the equity market. The current economic environment begs for a 50 basis point rate cut, but I'm just hoping the Fed at least goes with 25 basis points. The reason I believe the Fed should do 50 is simple:
The lower inflation level that Fed Chief Powell said was transitory will not be transitory if he allows the dollar to further strengthen, thereby putting further downward pressure on commodity prices. The European Central Bank (ECB) has been quite dovish and if the Fed takes any position other than dovish, the dollar ($USD) will soar, commodity prices will fall further and a potential DEflationary spiral could begin. That is the absolute LAST thing that equity traders want to see, which is exactly why the Fed Chief's mistakes in the past resulted in a 20% drop in the S&P 500 in Q4 2019 and a 7% drop in May 2019.
The Fed needs to get it right or U.S. stock indices will pay yet another hefty price.
After the bell last night, Apple (AAPL) reported its latest quarterly results. The stock had been trading quite well heading into its latest report, so I'm not surprised at all to see the numbers posted. AAPL easily topped both revenue and EPS estimates and should provide a big lift to technology shares in general.
I believe one stock tonight after the bell will absolute crush their numbers based upon the way it's been trading on a relative basis. I'm not a huge fan of holding stocks into their earnings reports because sometimes even the best reports are met with selling as the good report is already priced in. Still, I expect a HUGE report. If you'd like the company, shoot me an email to "tomb@stockcharts.com". I'll get back to you by this afternoon. In the subject line, write "Big Earnings Report" so I can quickly identify your email and respond. Thanks!
Pre-Market Action
Asian markets were rough overnight, while European indices are attempting to rebound after a rough day yesterday. Crude oil ($WTIC) is higher this morning and, of course, everyone is awaiting the Fed's policy decision at 2pm EST today.
U.S. futures are looking to reverse their weakness the past two days with Dow Jones futures higher by 75 points with 30 minutes left before the open.
Current Outlook
Aggressive areas like transports ($TRAN) and small caps ($RUT) have lagged badly during the recent march to all-time highs in the S&P 500. But both of these groups are beginning to show signs of strengthening. The RUT still is underperforming the S&P 500, but that could change if its recent ways continue:
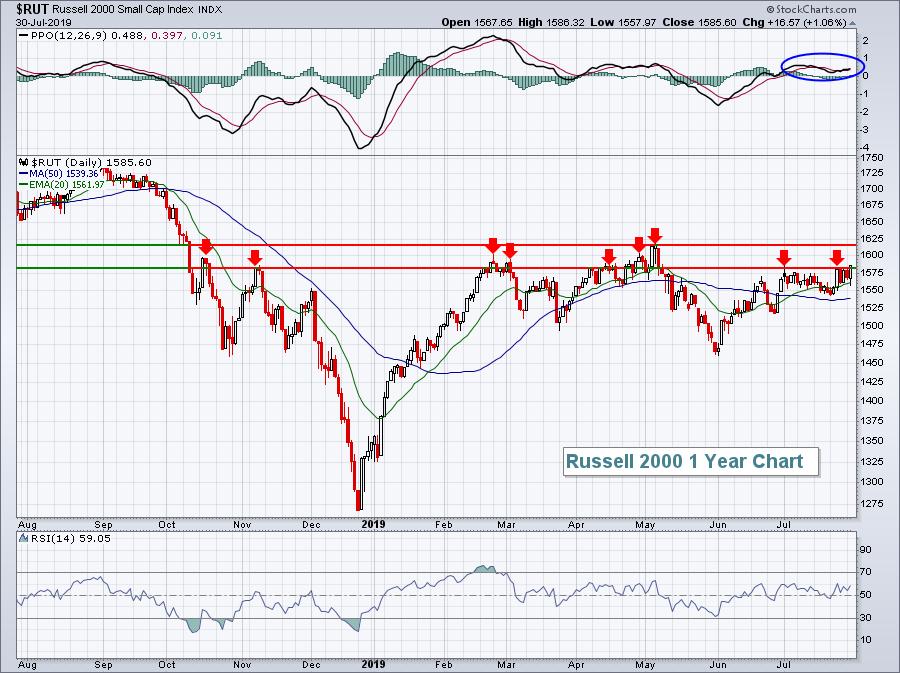
A definitive drop back beneath the 1525 level would be problematic. But currently, there are signs of momentum strengthening, especially given the PPO's extended stay above the zero line. Also, yesterday's close was the RUT's highest in the past 10 weeks. Still, an overhead price resistance zone from 1580-1620 is being tested. Should the RUT be able to break above that level and sustain it, it would add a tremendous amount of bullishness to a market where we're already seeing all-time highs across most major indices and aggressive sectors.
Sector/Industry Watch
Nondurable household products ($DJUSHN, +3.35%) may sound like a boring group, but it's been anything but that over the past year. The group broke out of a relative ascending triangle yesterday as it was the top performing industry group. Despite the affiliation with the defensive consumer staples sector, companies in this space are growing their earnings rapidly and are being handsomely rewarded:
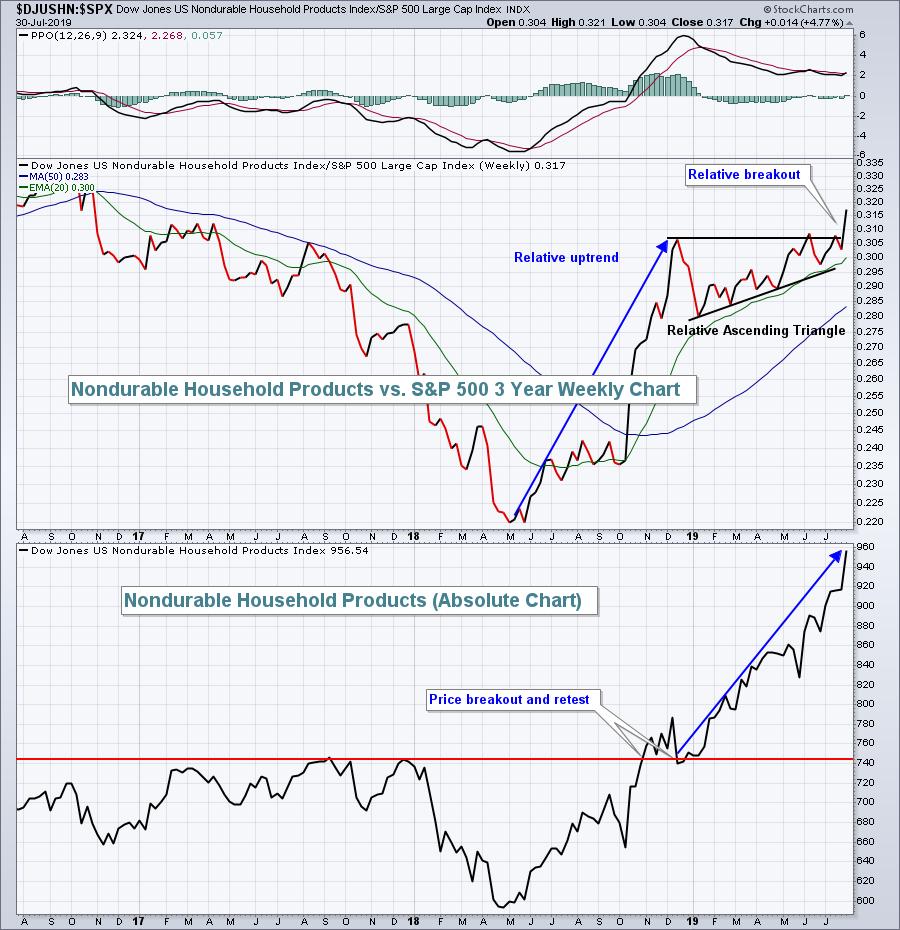
Sticking with groups that are outperforming the benchmark S&P 500 improve your odds of success. I still favor aggressive sectors, but straying into a defensive industry group like the one above, especially for more conservative investors/traders, makes a lot of sense.
Historical Tendencies
We typically see a lot of window dressing at the end of months and simply smart money buying ahead of incoming cash flows to start a calendar month. The proof is in the numbers. Here are the annualized returns by index for the 31st calendar day of all applicable months:
S&P 500 (since 1950): +30.82%
NASDAQ (since 1971): +51.25%
Russell 2000 (since 1987): +74.64%
Key Earnings Reports
(actual vs. estimate):
ADP: 1.14 vs 1.13
AMT: 2.01 vs 1.93
APTV: 1.33 vs 1.13
BHGE: .20 vs .19
CDW: 1.60 vs 1.51
CHD: .57 vs .52
CME: 1.76 vs 1.75
D: .77 vs .75
EPD: .55 vs .52
ETR: 1.35 vs 1.38
GE: .17 vs .12
GRMN: 1.16 vs 1.00
HES: (.09) vs (.10)
HUM: 6.05 vs 5.24
JCI: .69 vs .63
LHX: 2.44 vs 2.30
MCO: 2.07 vs 1.98
NLSN: .53 vs .41
SO: .80 vs .72
SPG: 2.99 vs 2.98
SPOT: (.47) vs (.51)
SPR: 1.71 vs 1.64
TAP: 1.52 vs 1.65
WLTW: 1.78 vs 1.76
(reports after close, estimate provided):
APA: .04
ATR: 1.13
ATUS: .08
AVB: 2.31
AWK: .94
AYX: (.06)
CF: .81
CTSH: .93
CXO: .74
DRE: .35
DXCM: .00
EQIX: 5.57
ES: .73
FICO: 1.90
H: .42
HCP: .43
HOLX: .61
LNC: 2.32
LRCX: 3.40
MAA: 1.53
MASI: .73
MCK: 3.04
MET: 1.31
NLY: .26
OXY: .91
PRU: 3.22
QCOM: .76
SLF: .94
TRMB: .54
TS: .35
TWLO: .02
TYL: 1.30
VICI: .37
VRTX: 1.03
WDC: .18
WELL: 1.04
WMB: .23
Key Economic Reports
July ADP employment report released at 8:15am EST: 156,000 (actual) vs. 155,000 (estimate)
Happy trading!
Tom
