Market Recap for Monday, August 19, 2019
The S&P 500 rallied for a third consecutive day, this time rising 1.21% and closing back above its 20 day EMA for the first time in August. The other major indices also rallied, including leadership from the NASDAQ and Russell 2000, which climbed 1.35% and 1.02%, respectively. In addition, all 11 sectors advanced with particular strength in energy shares (XLE, +2.21%).
Estee Lauder (EL, +12.52%) reported excellent quarterly results that topped Wall Street consensus estimates, but honestly, one look at the chart leading up to earnings would have suggested strong results were likely coming:
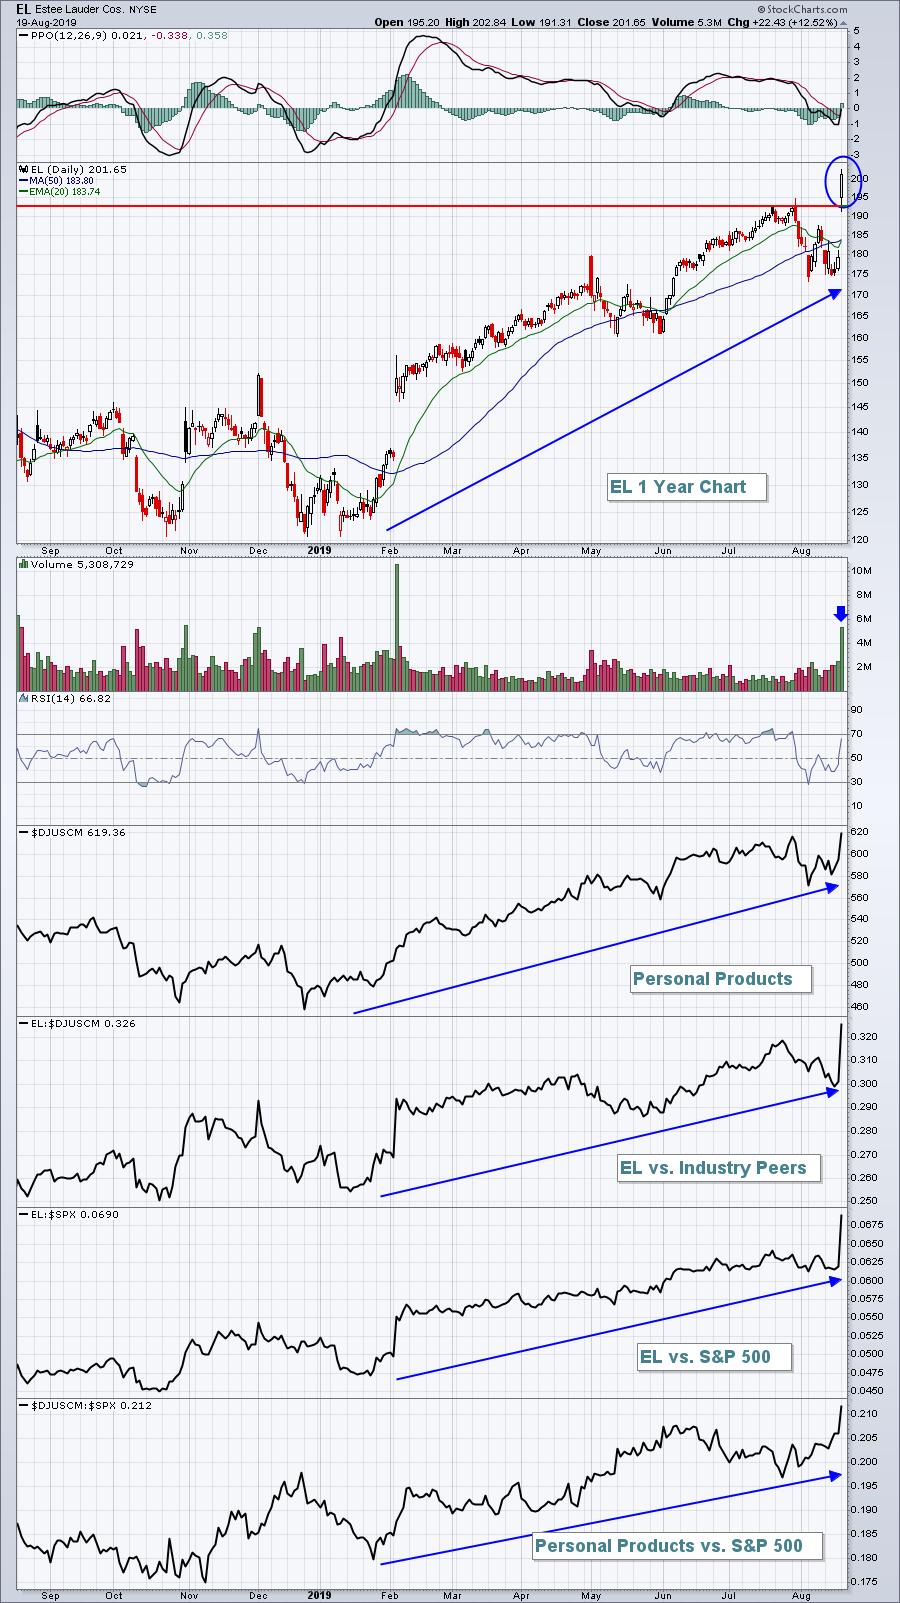
Any time my relative charts are all showing relative strength across the board like this, it's an indication from Wall Street that a company is likely to report solid results. I always stay very focused on relative strength and author a free newsletter that focuses on the combination of fundamentals and technicals. It's sent out 3 times a week and includes stocks and industry groups that show either relative strength or relative weakness, helping to keep my readers in the right groups and avoiding the wrong groups. CLICK HERE to subscribe. Again, it's 100% free.
As you might expect, lagging sectors on Monday were mostly defensive. Utilities (XLU, +0.64%) was the weakest sector, but still had nice gains and extended its Friday breakout to all-time highs.
Pre-Market Action
Gold ($GOLD) and crude oil ($WTIC) are both close to their respective flat lines today, while the 10 year treasury yield ($TNX) is once again under pressure, down 4 basis points to 1.56%.
Asian and European markets are very mixed after solid global performance yesterday. Here in the U.S., futures are mostly flat. Dow Jones futures are higher by 2 points with 30 minutes left to the opening bell.
Current Outlook
Let's take a step back today and review the Big Picture on an S&P 500 weekly chart. The first thing I'd like to point out is the long-term up channel that defines this current bull market. We have volatility, not a bear market:
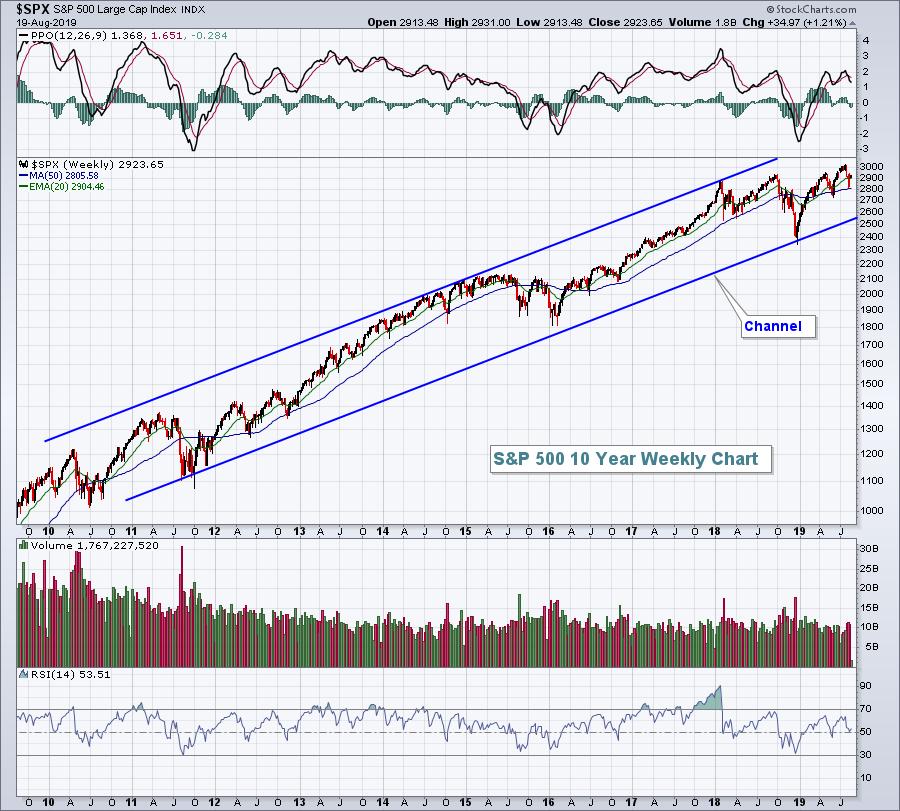
In drawing this channel, I started by connecting the two most important highs - the first one that ended in early-2015 and the second one that ended after the huge surge in January 2018. That same exact line was then copied and moved to connect the high volatility price lows in 2011 and again in December 2018. Note the 2016 low nearly touched this line as well. If we drop further in the August-September time frame, which wouldn't be all that unusual from a historical perspective, then it only sets up long entry with a greater reward to risk.
Let's shorten that chart above to simply look at the last couple years on a weekly chart:
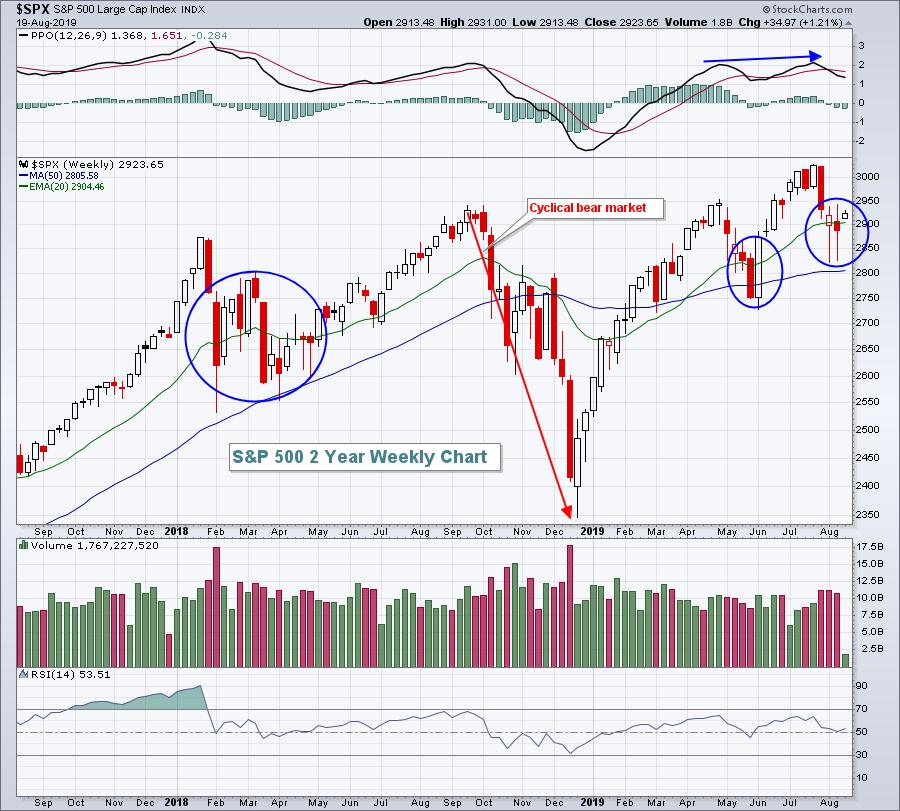
The red directional line highlights the cyclical bear market that occurs periodically in a secular bull market. If you've studied history, these don't occur every year. They happen very sporadically. While nothing in the stock market would shock me, I would be surprised to see another similar drop in 2019. In order to do so, we'd need to see a close on the S&P 500 beneath the March and June lows near 2725.
The blue circles above just show a bit of turmoil around the rising 20 week EMA. This could continue in the near-term, especially as more and more news breaks on the trade front. I would not be at all surprised, however, to see the S&P 500 push to new all-time highs.
Sector/Industry Watch
The Dow Jones U.S. Home Construction Index ($DJUSHB) has been consolidating all summer, but is on the verge of a significant breakout with its daily PPO on the rise. That strengthening momentum would confirm a price breakout. Interest rates remain near historic lows, which continues to provide a tailwind for this industry. Still, we need to see a breakout:
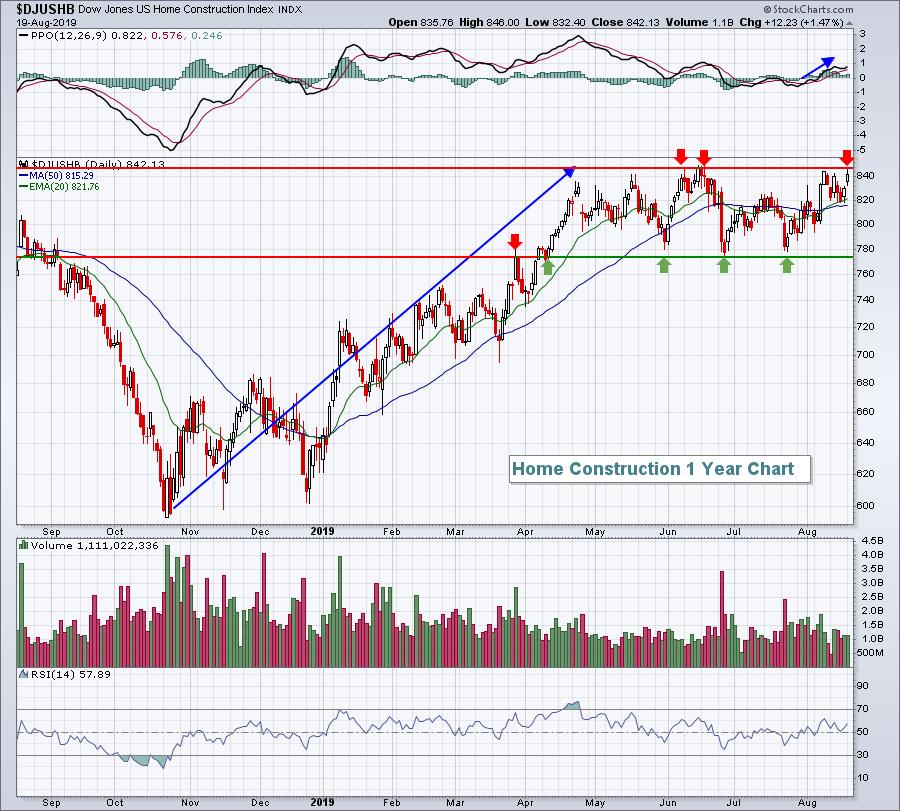
A possible catalyst is Toll Brothers (TOL), which reports its earnings after the bell today. Check out the Historical Tendencies section below for additional relevant information here.
Historical Tendencies
Most stocks struggle during August, but there are outliers. Toll Brothers (TOL) is one of those as you can see from its August performance over the last two decades:
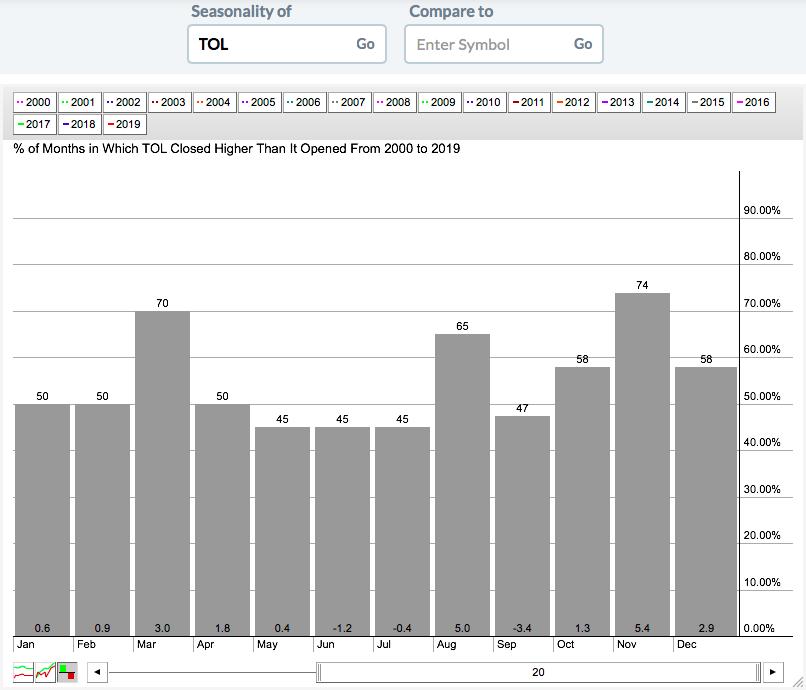
August has trailed only November in terms of best monthly returns this century.
Key Earnings Reports
(actual vs. estimate):
HD: 3.17 vs 3.07
KSS: 1.55 vs 1.52
MDT: 1.26 vs 1.18
MSG: (3.08) vs (2.34)
SE: (.37) vs (.58)
TJX: .62 - estimate, awaiting results
(reports after close, estimate provided):
AMCR: .15
CREE: .10
JKHY: .77
NDSN: 1.80
TOL: .82
URBN: .58
Key Economic Reports
None
Happy trading!
Tom
