Market Recap for Wednesday, August 28, 2019
10 of 11 sectors advanced in a broad-based rally on Wednesday that carried the Dow Jones higher by 1%. The small cap Russell 2000, a major laggard in 2019, rose 1.15% in a rare day of outperformance. Energy (XLE, +1.43%), consumer discretionary (XLY, +1.25%), and industrials (XLI, +1.23%) were easily the three best performing sectors. Discretionary stocks were lifted by a very strong retail group. The widely-diversified retail ETF (XRT, +2.67%) had arguably one of its best days in 2019, but did still manage to close beneath its 20 day EMA. It was only 0.5% beneath it, however, and will be an ETF to follow closely. GDP (2nd estimate) came in as expected this morning at 2.0% and consumer spending is the big reason our GDP is so much stronger than most other parts of the world.
Another big development was the Dow Jones Transportation Average ($TRAN, +1.77%), which was a primary reason for strength in industrials. It came at a great time because the TRAN was testing key price support from its May low and it produced a bullish engulfing candle there as well. We could see a big rally from here in the TRAN:
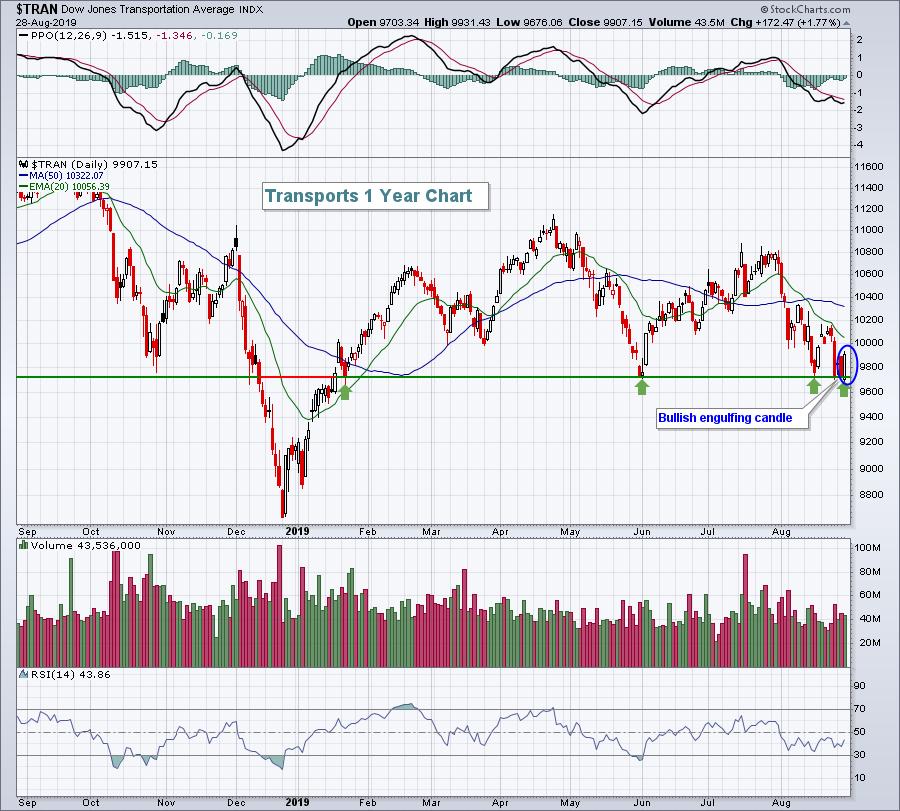
While I believe this sets the stage for at least a short-term rally in transports, we should respect any close below 9700. That would eliminate the short-term bullish signal provided yesterday.
Pre-Market Action
Futures are strong this morning after China said they have no plans to retaliate to the latest tariffs imposed by the U.S. Asian markets were mixed overnight, but there's considerable strength in Europe. Dow Jones futures are higher by 271 points as we approach the start of another trading day.
Current Outlook
Consumer stocks remain quite popular and for good reason. The second estimate of the GDP is out this morning and there's one HUGE reason why our economy grew. Consumer spending. The consumer is alive and well and that's very good news for the stock market. Historically low interest rates make borrowing cheap and the historically low unemployment rate means a healthier consumer. That combination will help to ensure that the consumer remains strong.
As you probably know, I like to follow the stock market's appetite for consumer discretionary stocks (XLY) vs. consumer staples stocks (XLP). As long as the overall trend of that ratio (XLY:XLP) is higher, I'll feel very strong about my bullish call. The S&P 500 tends to follow this ratio with a very positive correlation coefficient so it makes very good sense to chart the XLY:XLP, although I'd be careful to read too much into short-term weakness. There will always be bouts of relative profit taking in the XLY:XLP, especially after huge relative runs higher - just like the one we saw during the last major bull market advance from late-2016 through early-2018.
Here's the current look at the ratio on a long-term 20 year weekly chart:
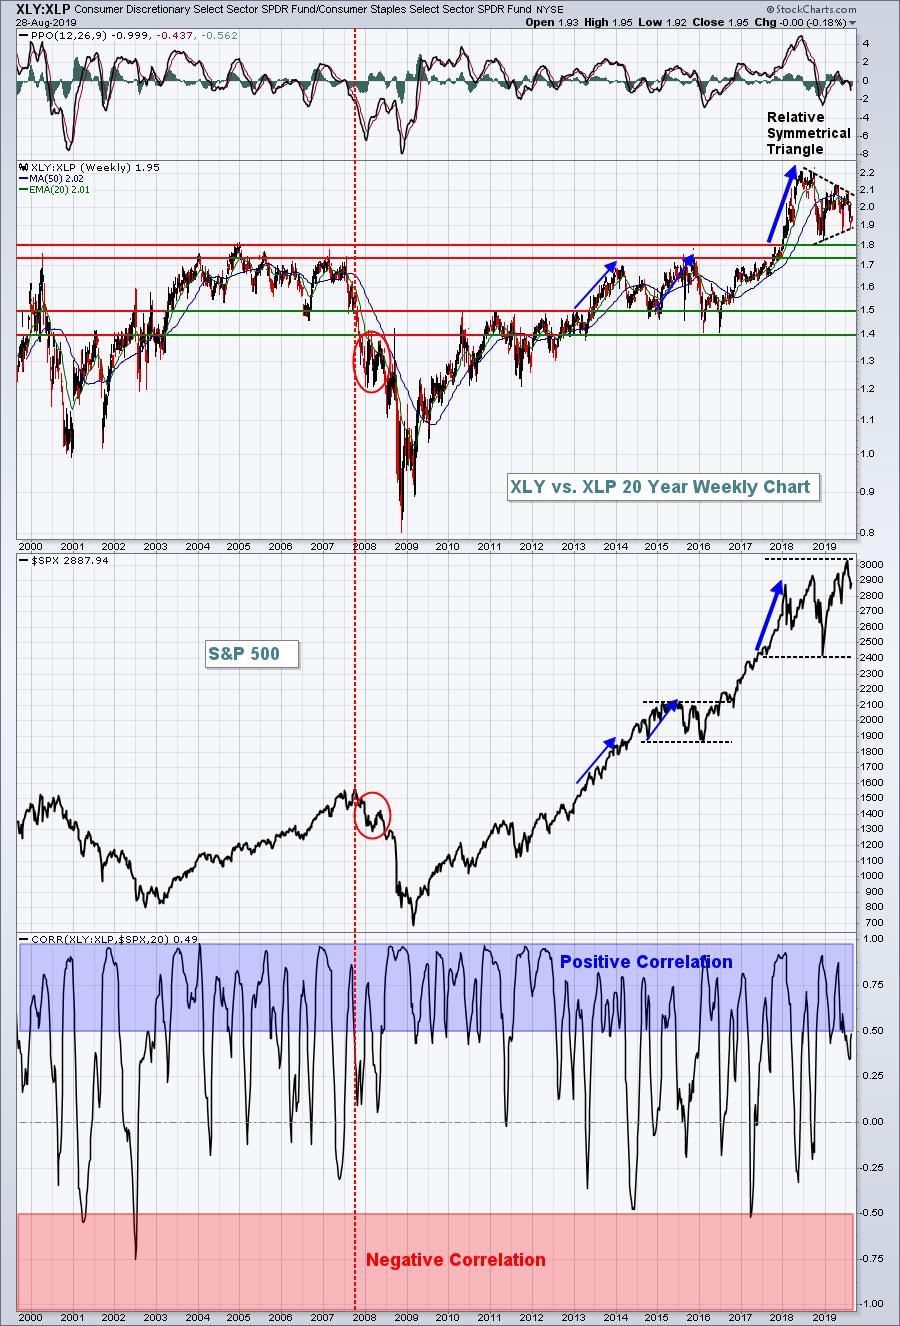
Here are a few takeaways:
(1) The bottom of the chart shows the correlation between the XLY:XLP and the S&P 500. The blue shaded region highlights periods where these two are extremely positively correlated, which is quite often. The red shaded area shows the extreme negative (or inverse) correlation. We don't see that very often. If there's one thing to understand, it's that we need to keep a very close eye on how discretionary stocks trade vs. staples stocks. Currently, I see a period of consolidation following a major uptrend - a bullish pattern.
(2) I can understand how some might interpret the XLY:XLP weakness since mid-2018 to be a bearish signal. But look at that heavy blue directional line in the second half of 2017 into 2018. Consumer discretionary absolutely crushed consumer staples during that period. The ratio climbed from 1.70 to 2.20 in less than a year! That type of move in such a short period of time is nearly unprecedented. Let's give the ratio time to consolidate and base before breaking out again. After the huge move higher in this ratio from 2009 to 2011, you can see that it consolidated for more than two years, even though the S&P 500 broke out to new highs twice during that period. A bigger warning in my view would be the S&P 500 breaking out to new highs with the XLY:XLP ratio falling back beneath the 1.75-1.80 relative support area.
(3) Check out this ratio in October 2007 at the ultimate stock market top. It was near a 4-5 year relative low. When the S&P 500 began to fall, the XLY:XLP ratio collapsed (red circles). That was most definitely a confirming signal to abandon U.S. stocks. I see nothing of that sort right now.
This bull market, despite the short-term issues and volatility, remains in high gear. I wouldn't bet against it.
Special Announcement
I wrote a couple weeks ago that I would be moving back to EarningsBeats.com as its Chief Market Strategist, effective September 15th. I'm currently developing our product and service lineup that will be announced very soon to everyone. I do plan to keep my Trading Places blog right here, although the format and content will likely be changed . It'll simply be a case of less time to commit here as StockCharts.com announces its new fall lineup on StockCharts TV. I will be moving to a morning show and going solo as part of Trading Places LIVE!, a 30 minute show airing on Tuesdays and Thursdays from 9:00-9:30am EST that will take you right up to the opening bell. I'll plan to give you an in depth look at breaking news and help to prepare you for a new trading day. Of course, there'll be a big dose of earnings previews and reviews and relative strength, while also keeping you updated on technical developments changing "beneath the surface" - developments that only technicians will see.
The product and service lineup I see for members is very exciting as I plan to keep our members apprised of in-the-moment happenings on our Strong Earnings ChartList stocks, running intraday scans and sharing results of those scans, Monday and Wednesday Trading Places LIVE! webinars to complement the Tuesday-Thursday shows that I will be hosting on StockCharts TV. I also am planning to provide our members with early signals as to strengthening industry groups, to catch individual stock moves early. Finally, a weekly review of our Model, Aggressive and Income portfolios' component stocks will keep everyone up-to-date on portfolios that have been crushing the S&P 500. I'll be providing further details this weekend right here in my Trading Places blog so be on the lookout for more! In the meantime, come join the thousands of EarningsBeats.com community members that enjoy our EB Digest. It's a free newsletter that is sent to your email box first thing on Mondays, Wednesdays and Fridays. In addition to providing education relating to recent or upcoming earnings and relative strength, we also offer big discounts there to folks who'd like to become part of our paid service.
CLICK HERE to subscribe to our FREE EB Digest. I appreciate your support!
Sector/Industry Watch
I believe there's a lot of misinformation distributed regarding defensive areas of the stock market leading on a relative basis. The actual data supports these stock market naysayers as both the three month and six month periods show leadership from consumer staples (XLP) and real estate (XLRE), but defensive sectors always show more strength during periods of declining equity prices or throughout lengthy periods of consolidation. I believe we have been, for the most part, consolidating since the highs of January 2018. In my view, it's been very similar to what we experienced from late-2014 through early-2016. There was lots of talk of a bear market then and we continue to get that same talk now. I think it's hogwash, but only time will tell.
For the "here and now", defensive stocks are performing solidly. Utilities (XLU) has been trending higher for quite awhile as the following 5 year uptrend would attest:
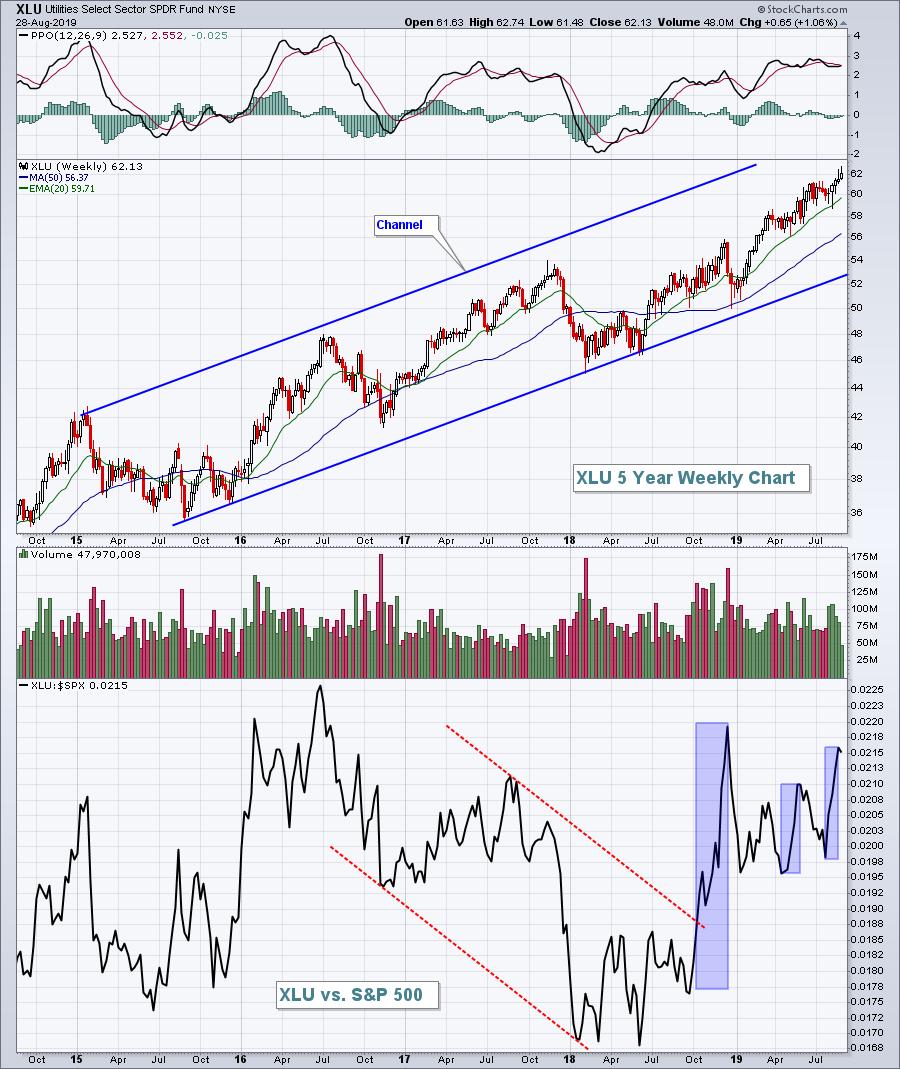
At the bottom of the chart, though, you can see that the overwhelming majority of its relative strength (blue shaded rectangles) have occurred when the stock market falls and fear ramps up. I'll become more of a believer in the bear market argument when we see defensive groups lead during a final fateful bull market rally, while aggressive sectors fall. Smart money gets out ahead of a bear market and at the start of it. The charts will tell us when a bear market is approaching. You won't hear it first on CNBC, that much I can promise you.
Historical Tendencies
Nike, Inc. (NKE) loves the month of September and then the fourth quarter to boot! NKE has averaged gaining 12.7% from September through December over the past 20 years. That's an impressive track record. Is it "back to school" that kicks things off? I don't know, but I do know the seasonality is very strong as you can see below:
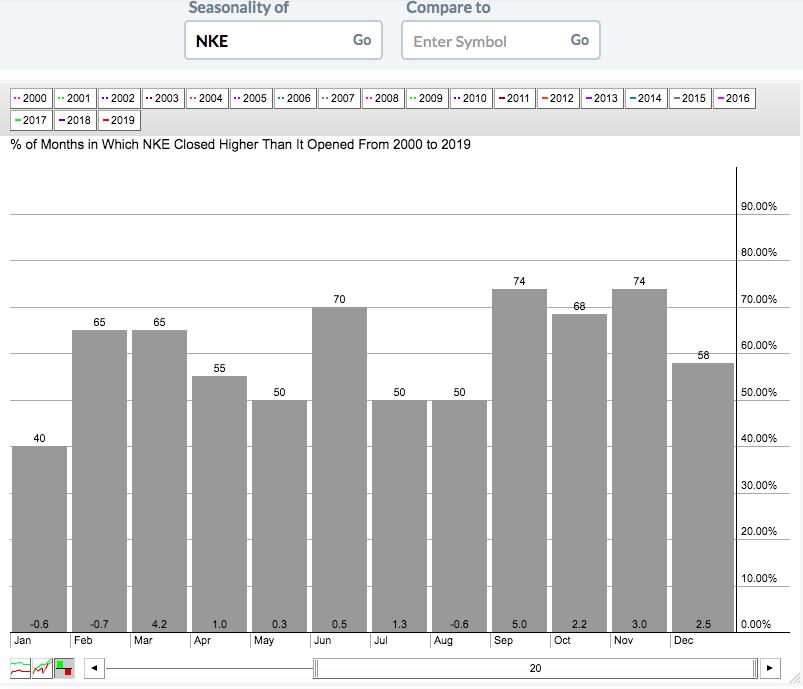
Technically, NKE broke back above its 20 day EMA yesterday. A further strengthening to include a break above its 50 day SMA might be enough to trigger the seasonal bullishness ahead.
Key Earnings Reports
(actual vs. estimate):
BBY: 1.08 vs .99
BURL: 1.36 vs 1.15
DG: 1.74 vs 1.58
DLTR: .76 vs .70
SAFM: 2.51 vs 2.84
TD: 1.34 vs 1.34
TECD: 2.69 vs 2.33
(reports after close, estimate provided):
COO: 3.16
DELL: 1.46
MRVL: .15
ULTA: 2.79
WDAY: .35
Key Economic Reports
Q2 GDP (2nd estimate) released at 8:30am EST: 2.0% (actual) vs. 2.0% (estimate)
Initial jobless claims released at 8:30am EST: 215,000 (actual) vs. 213,000 (estimate)
July pending home sales to be released at 10:00am EST: -0.3% (estimate)
Happy trading!
Tom
