Market Recap for Wednesday, July 31, 2019
To say that this current Fed is transparent would be the equivalent of saying I'm a marine biologist (a Seinfeldism for those of you that are fans). What the heck are they doing? Seriously, what is going on in those meetings? Some believe they're being influenced by the White House, I do not. But why are they so slow to react? Prior Feds were bound and determined to allow the financial markets to know what they were going to do before they did it. Ben Bernanke stressed transparency. Janet Yellen followed suit. I honestly don't know what Jerome Powell is going to do from meeting to meeting, except that he has been consistently late to the party almost every time.
The stock market's selloff yesterday afternoon was Fed-induced once again. It happened in Q4 2018 as this Fed remained adamantly hawkish despite the bond market begging for dovishness. I understand that the Fed needs to do what they believe is right and needs to remain independent. I have no problem with that. BUT....the bond market was right!!!! The Fed later back-tracked and said they were wrong to suggest further rate hikes in 2019. In their April/May meeting, Powell infamously said that the drop in inflation was transitory. How can it be transitory when the CRB Index ($CRB) has been falling for 8 years??? When the U.S. central bank is more hawkish than the rest of the world, the dollar ($USD) goes up. Did you see the USD's reaction yesterday? It broke out to a new 2 year high. A rising dollar puts downward pressure on commodity prices, which in turn lowers inflationary pressures. This is Economics 101. Everyone is so focused on "why does the Fed need to lower, our economy is fine?" Well, here's why. The Fed's mandate is to maximize employment and to stabilize prices. The absolute worst scenario for the stock market is a disinflationary environment. Going a little higher than the 2% target is much better than going lower. We need to lower the USD in order to pump up commodity prices. And we have the room to do it. That's why rates should be lowered. If the European Central Bank (ECB) lowers rates, and we don't, our currency will surge higher. The Fed needs to avoid that.
One month later, the Fed back-tracks once again, saying that lower inflation is more persistent and recognizes that they might need to lower rates. Now let's fast forward to 2pm EST yesterday. The Fed realizes it was wrong and lowers by a quarter point. The bond market has been suggesting perhaps 3 rate decreases in 2019. So what does the Fed say in its post-meeting announcement? Essentially, we're going to wait and see. Great transparency there.
Here's what the stock market loathes. UNCERTAINTY. And the stock market is a big part of consumer confidence. This Fed, for the 3rd time in less than a year, is doing its very best to bring the U.S. stock market down. Forget the White House, this isn't politics. It's about a Fed that is unraveling everything that Bernanke and Yellen established. Mark my words. The Fed will lower again. And they'll be late to the party one more time. That's the only thing transparent about this Fed. They're very, very slow to act.
Ok, rant over.
The U.S. stock market took a dive after the Fed announcement with the Dow Jones losing nearly 500 points in less than an hour. We did rebound temporarily before selling off into the close. All 11 sectors finished lower with energy (XLE, -0.32%) the best relative performer. Consumer staples (XLP, -2.03%) was hit the hardest.
Pre-Market Action
Dow Jones futures are pointing to a very modest open higher, up by 25 points with only 20 minutes to go to the opening bell.
The 10 year treasury yield ($TNX) is down to 2.01% as the bond market ignores the Fed once again, realizing there's a chance the Fed will get it right.....eventually.
Current Outlook
Our major indices have broken out to all-time highs recently, but have done so with negative divergences on their daily charts. Weekly charts, however, are quite strong and suggest that we're going higher. The ride could be a little bumpy given the negative divergences on the daily charts, along with rough seasonality (see Historical Tendencies below). Here's a look at the S&P 500 daily chart:
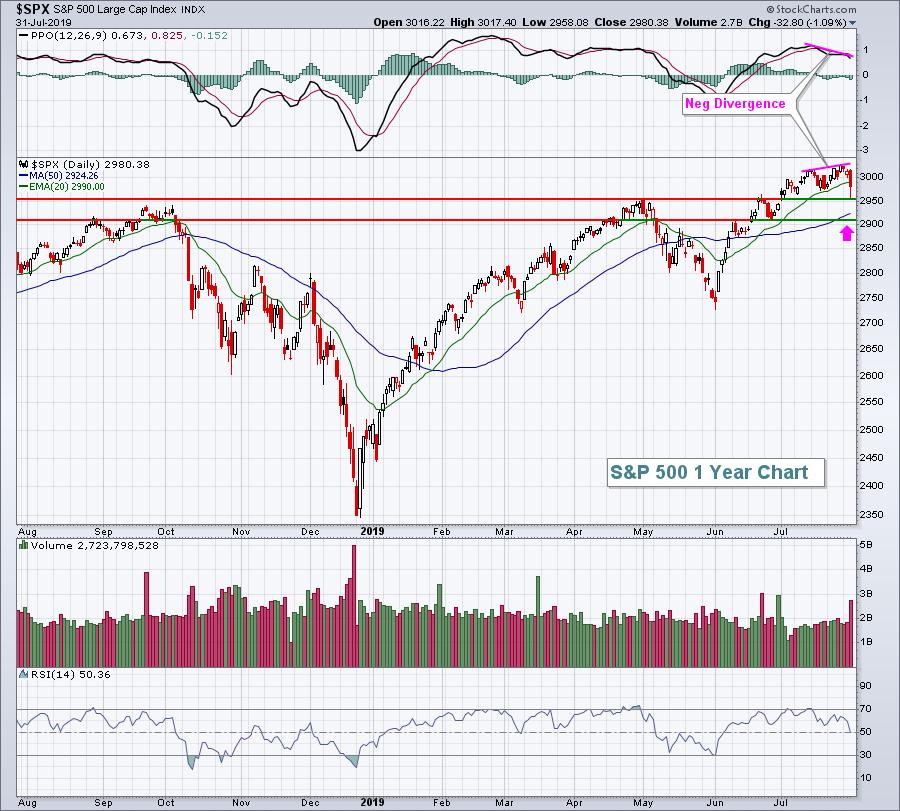
There seems to be fairly solid short-term support between 2900-2950 and it's worth noting that the rising 20 week EMA (not pictured in above daily chart) is currently at 2907. I wouldn't assume that short-term consolidation will turn into more intermediate-term issues.....until it does. It's so easy to view the stock market with a negative bias given all the awful headline news, but we're a few days removed from all-time highs and aggressive sectors have been leading the way. Turning too bearish, even with the bearish summer seasonality, I believe would be a big mistake. It's just one opinion here, but it serves me well to view the market bullishly until technical confirmation says otherwise.
Sector/Industry Watch
Yesterday, I asked you to send me a request if you wanted to know a company that I believed would report blowout earnings. The stock was Alteryx, Inc. (AYX), a software company ($DJUSSW). Well, the results are in. AYX beat easily on both revenues and EPS and the stock is up over 7% in pre-market action, which would be an all-time high. I didn't talk to management. I don't have insider information. But I do have one thing. My charts. Take a look at AYX heading into its earnings report:
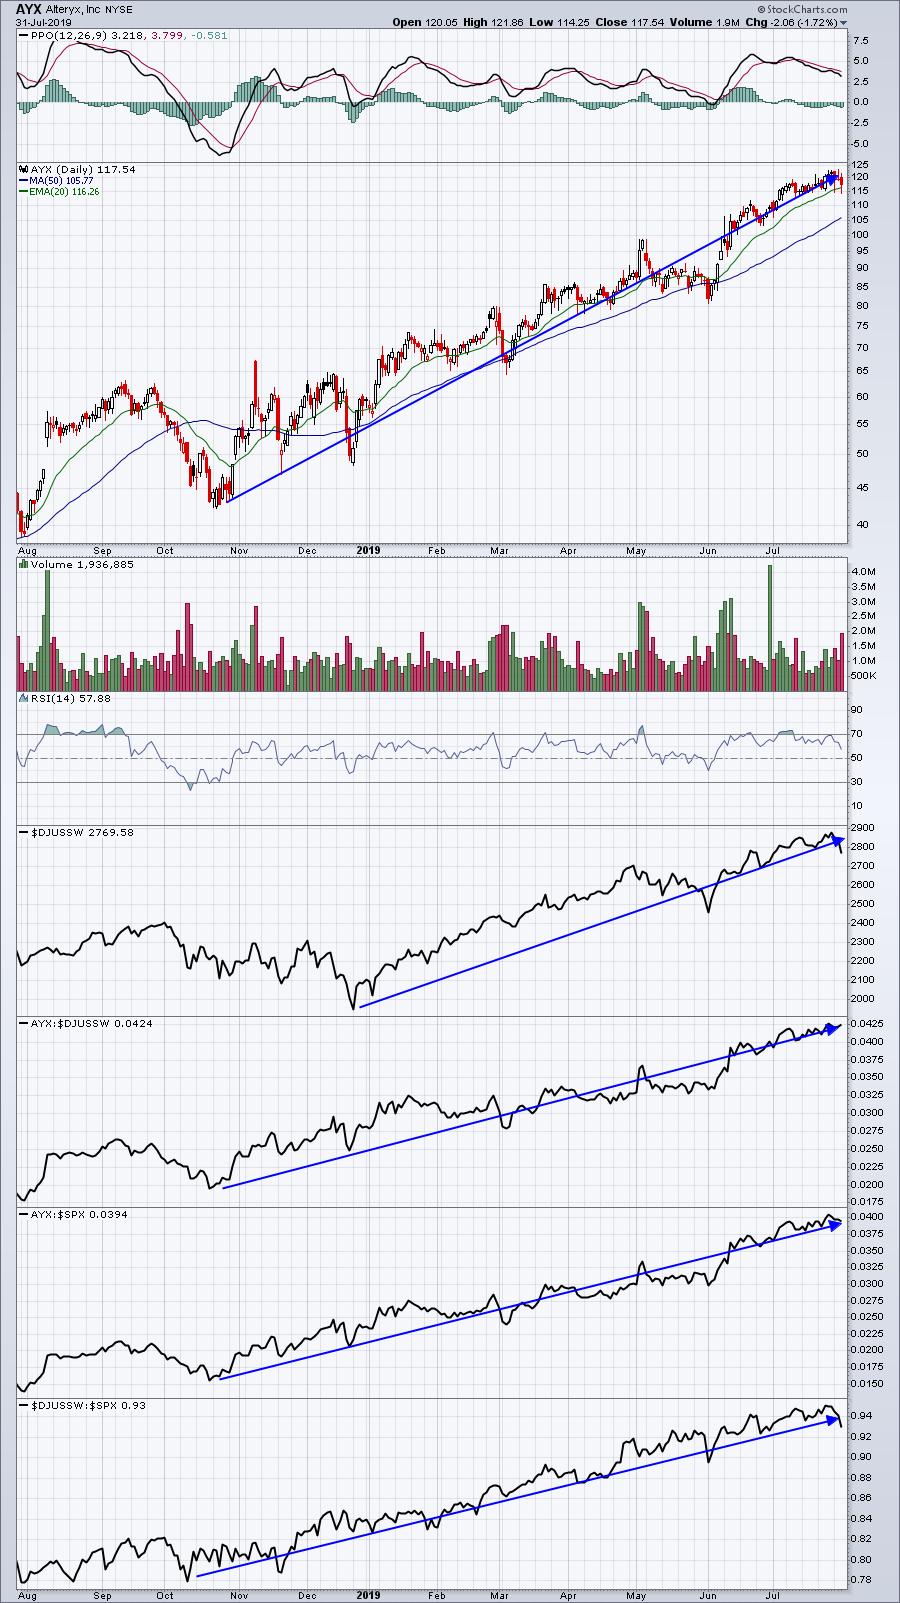
Do you see how every trend is pointing up and to the right? That tells you that you have a great relative performer. AYX is a great software stock and software is in favor with Wall Street. Analysts visit company management teams every day (until the quiet period before earnings begins). They have a pretty good idea how the company is doing in terms of meeting its goals (revenue and EPS estimates). Those companies that are trading well into earnings have the best chance, in my opinion, to exceed their earnings estimates. AYX was a perfect example.
If you missed out on AYX yesterday, send me an email today to "tomb@stockcharts.com". I have another stock to two that you should watch after today's closing bell. :-)
Historical Tendencies
August is a not-so-good month historically for U.S. equities. Since 1950, the S&P 500 has produced annualized returns of -0.50% for the month of August. Only September (-5.51%) has performed worse over the past 7 decades. August and September are the only two calendar months that have produced negative annualized returns on the S&P 500. Yep, we're in the heat of summer and we're also entering the heat of selling season for equities.
Key Earnings Reports
(actual vs. estimate):
ABC: 1.76 vs 1.63
ABMD: 1.00 vs .99
ADM: .60 vs .61
BCS: .31 - estimate, awaiting results
BLL: .64 vs .65
BR: 1.72 vs 1.72
CBRE: .81 vs .78
CI: 4.30 vs 3.73
CLX: 1.88 vs 1.85
DD: .97 vs .86
DNKN: .86 vs .82
EXC: .60 vs .63
GM: 1.64 vs 1.43
ICE: .94 vs .92
IDXX: 1.43 vs 1.37
K: .99 vs .91
MPC: 1.73 vs 1.33
MPLX: .55 vs .60
MSCI: 1.54 vs 1.49
MT: .49 vs .49
PH: 3.31 vs 3.09
RDS.A: .86 vs 1.22
SHOP: .14 vs .03
SPGI: 2.43 vs 2.25
TFX: 2.66 vs 2.59
TRI: .29 vs .16
TRP: .75 vs .75
VZ: 1.23 vs 1.20
W: 1.35 vs 1.36
XEL: .46 vs .53
XLY: .79 vs .79
YUM: .93 vs .87
(reports after close, estimate provided):
ANET: 2.22
BMRN: .17
DVA: 1.10
ED: .60
EOG: 1.33
ETSY: .14
FTNT: .50
GDDY: .17
HIG: 1.11
LNT: .46
MSI: 1.60
MTD: 5.09
OLED: .46
OTEX: .72
PBA: .42
PINS: (.09)
REG: .96
SQ: .16
Key Economic Reports
Initial jobless claims released at 8:30am EST: 215,000 (actual) vs. 214,000 (estimate)
July ISM manufacturing index to be released at 10:00am EST: 51.9 (estimate)
June construction spending to be released at 10:00am EST: +0.3% (estimate)
Happy trading!
Tom
