Wyckoff Power Charting February 25, 2018 at 04:07 PM
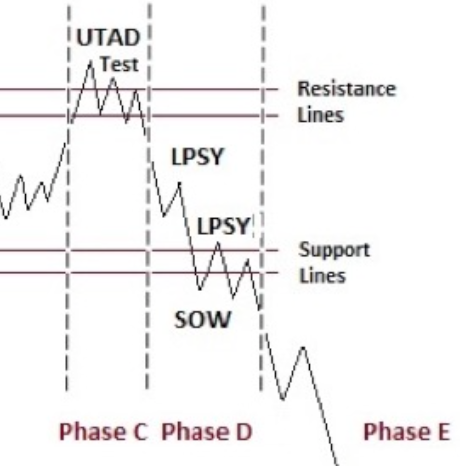
It has been a long time since we have explored the intricacies of the Wyckoff Distribution structure. But since 2018 has opened with a Bang, by going straight up in January and then early February’s retracement of the prior month’s advance, it is time to review... Read More
Wyckoff Power Charting February 19, 2018 at 12:53 PM

The Law of Cause and Effect is a cornerstone principle of the Wyckoff Method. Cause building on the chart precedes the Effect of a Markup or a Markdown. Wyckoffians meticulously study trading ranges on the charts for Accumulation or Distribution characteristics... Read More
Wyckoff Power Charting February 11, 2018 at 09:30 AM
As stocks have been getting roiled over the last two weeks, bonds have been somewhat overlooked. Bond prices began dropping in December 2017, and possibly contributed to the weakness in stock prices weeks later. It has been about a year since we have looked at treasury bonds... Read More
Wyckoff Power Charting February 04, 2018 at 02:41 PM
Apple, Inc. has been an endlessly illuminating Wyckoff Method case study during this bull market advance. The ascension of AAPL demonstrates the power of large institutional sponsorship. The top echelon of this sponsorship is what Wyckoffians call the ‘Composite Operator’ (C.O.)... Read More