SIGNAL LINES GALORE
One of the huge new features of SharpCharts2 is its ability to plot "indicators of indicators." In other words, SharpCharts2 can chart indicators based on the value of another indicator which, in turn, is based on the value of the chart's main stock, index or fund. In our last newsletter, I included an example of how you could use the Slope indicator to see the changes in the MACD more clearly. This time around I want to show you how the same technique can be used to add signal lines to just about anything.
A signal line is a moving average of an indicator that is typically plotted on top of the indicator so that cross-overs are easy to spot. Many indicators such as the MACD and Stochastics indicators are typically plotted with signal lines already. However there are still a large number of indicators that aren't typically plotted with signal lines. Fortunately, with SharpCharts2, StockCharts.com members can easily add signal lines to any indicator they want.
Earlier this week, subscribers to John Murphy's Market Message got a taste of just how powerful this capability can be when guest columnist Jeanette Young used a 5-period EMA signal line on the 20-period CCI indicator.
"The study on the bottom is one which I use, the Commodity Channel Index with a 5- period exponential moving average on top. The reason that this 5- period exponential moving average is placed on the CCI is to obtain better triggers than would be offered by the CCI alone. Were I to use the CCI alone, I would miss about 75% of the trade. By using the 5- period Exponential Moving average, I have created a trigger for both a buy and a sell." - Jeanette Young
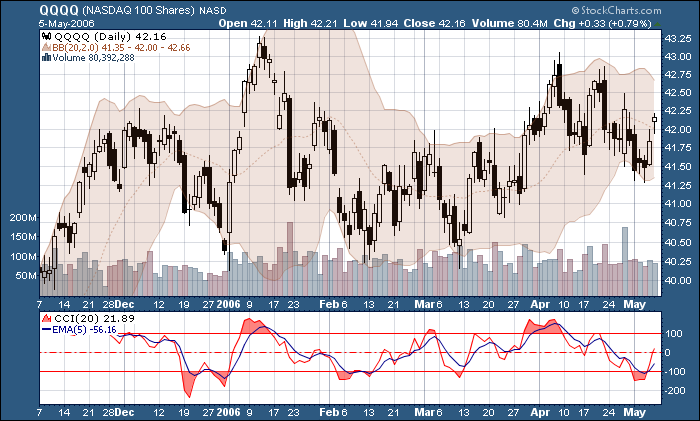
Here's an example of Jeanette's technique in action:
(Click on the chart to see the parameter settings.)
To create this chart, first log into your account, then plot a daily chart of the Qs with the Blue-Grey color scheme. Hit the "Clear All" button in the "Indicators" section to remove any other indicators, then add the "CCI" Indicator to the chart and click "Update." Click on the green "Advanced Options" triangle to pull-out those choices (sorry, you have to be a member to use the advanced options), then change the "Color" to red. The "Overlay" dropdown is the key to charting indicators of indicators. Select "Exp. Mov. Avg" from the "Overlay" dropdown, then enter "5" in the "Parameters" box.
That's it! Just click "Update" to see the final result. The 5-period EMA (in blue) crossed the red CCI line two days ago giving a sell signal. Note that these are pretty short-term buy/sell signals - you might want to use longer periods if you are a longer-term investor.
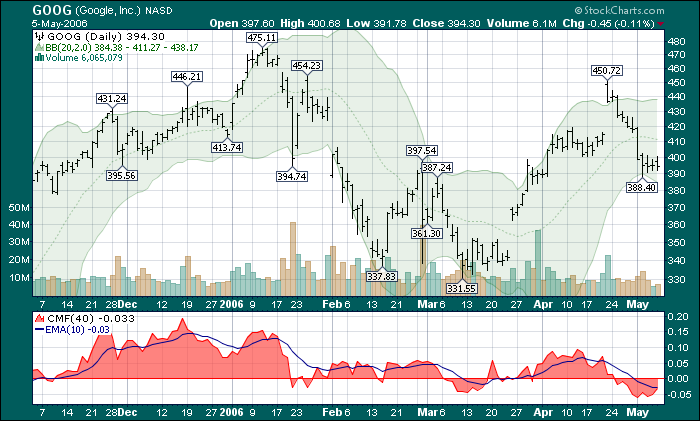
Here's another example using one of my favorite indicators, the Chaiken Money Flow. Long-term ChartWatchers know that I like the CMF because it combines price action with volume action to create one indicator. While longer-term CMF lines aren't super-jittery, adding a signal line to the mix can help you be sure you are seeing the indicator's message clearly.
(Click on the chart to see the parameter settings.)
In this case, I'm using a 40-day CMF combined with a 10-day EMA signal line. Despite the big declines of the last two weeks, this chart suggests things are looking up in the near term for GOOG as the CMF is just about to cross back above the blue signal line.
Signal line work well with indicators that are not too smooth and not too "angley." Signal lines on smoothed oscillators (like the ultimate oscillator) tend to give very few signals and most of those are late. Signal lines on "angley" indicators (like the Aroon) are unable to react quickly enough to the quick direction changes.
Other than those cases, signal lines work great. I encourage you to experiment with them on your charts and see how they can help you make better investing decisions.
- Chip Anderson
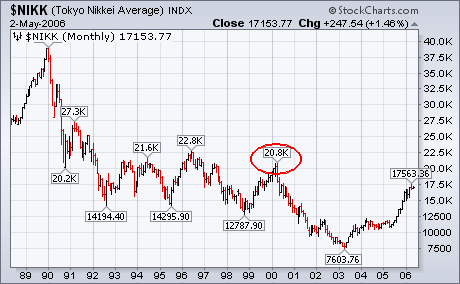
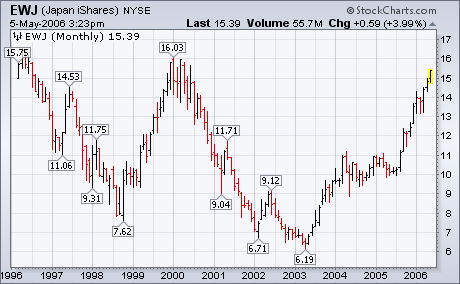
The first chart below shows why I believe Japan to be one of the best global values.
While most other global markets are at or near record highs, the Nikkei 225 has
recovered barely a third of its losses from 1990 to 2003. The Nikkei is still
down 55% from its 1990 peak at 39,000. During that same time span, the S&P
500 has risen over 300%. What I also like about Japan is that it's been poorly
correlated with other global markets over the last fifteen years. That makes it
an excellent global diversification vehicle. This isn't a new view. Those of you
who have followed by writing know that I was saying the same thing last summer
when the Nikkei was just breaking out of a base at 12K. There is a short-term
warning, however, that you should know about. The chart of the Nikkei shows the
next upside resistance barrier at its early 2000 peak just over 20K. That's
still 18% away from current prices. Chart 2, however, shows that resistance
level to be 16.03 in the the Japan iShares (EWJ). Today's trade at 15.39 puts
the EWJ within 4% of that resistance barrier. While I remain bullish on Japan,
you should know that the EWJ may run into some interim resistance around that
16.00 level.
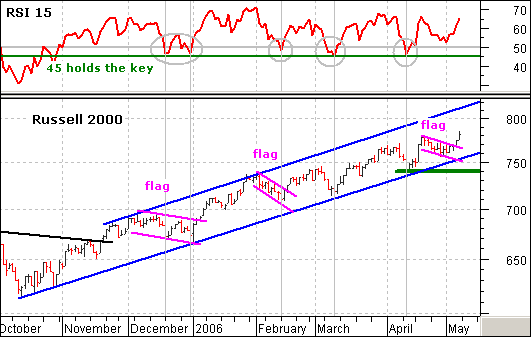
The Russell 2000 has not been the strongest broad index over the last few weeks, but it is still by far the strongest index in 2006 and shows no signs of stopping after another falling flag breakout on Thursday. This is the third such breakout since December and the death of small-caps has been greatly exaggerated. Longer term, the index remains in a rising price channel with lower trendline support at 755 and upper trendline resistance around 820.
I also use RSI to gauge the strength and direction of the long-term trend. This key momentum indicator moved above 50 in early November and then held above 45 in December, February, March and April. There is clearly lots of support at 45. As long as RSI holds 45 and the index holds the lower channel trendline, the flag breakout is bullish and we should expect further gains.
In addition to using RSI for the long-term trend, it can be used to identify playable pullbacks within the trend. Notice that RSI bounced after each pullback below 50 (gray ovals) and these dips represented excellent opportunities to partake in the bigger uptrend. RSI held above 50 on the most recent pullback (falling flag). The shallowness of the pullback shows underlying strength and I expect further gains.
On March 17 our trend model turned from bullish to neutral on the US dollar, and
since then the technical picture has continued to deteriorate. Prices have
dropped precipitously from near 90 to near 85, and the weekly 17-EMA has crossed
down through the 43-EMA, a long-term sell signal. (The weekly moving average
crossover is not "official" until the end of the week, so the sell signal could
be erased if there is a sharp rally on Friday.) The weekly moving average
crossover is a big deal, because, as you can see on the chart below, it doesn't
happen very often.
While price action and internals are negative, there is the possibility that
a bullish reverse head and shoulders is forming. There is a clear left shoulder
and head, and the support line at 85 could facilitate the formation of a right
shoulder. If the dollar can rally off the support at 85, we would want it to
rally up through the neckline drawn at 93 in order to execute the pattern. There
is no guarantee that this will happen, but it is a possibility.
The next chart is a long-term view of the dollar using a monthly chart (each
bar equals one month), and it shows another set of positives and negatives.
Starting with the negatives, the monthly PMO has topped, and the 6-EMA has
crossed down through the 10-EMA. Both are long-term sell signals.
On the positive side, we can see that there is very strong long-term support
between 78 and 80. If the reverse head and shoulders pattern fails to execute,
it could be that the current decline will lead to a double bottom on the support
around 80 in preparation for a strong upside trend reversal.
Bottom Line: We are currently neutral on the dollar, and the technical condition of the index is negative; however, support zones at 85 and 80 could provide a solid basis for a long-term bottom. Sentiment shows the lowest percentage of bulls since late-2004, so a short-term bounce is likely very soon.