The results are in! We have the five winners for our "Seeing Clearly with SharpCharts2" contest! Thanks again to everyone that entered. There were over one hundred entries and all of them were very well done. The judges' job was not easy at all.
The five winners (in alphabetic order) were: Aaron Brussat, Michael Ham, Kevin Krueger, Leilani Lazo, and Kevin Pasternack. Each will receive a Dell 24" LCD Monitor as their prize. In a surprise move, the judges also decided to award Craig Ferguson an Honorable Mention award and one free year of StockCharts.com service. Congrats to all of our winners!
You can see the winning charts along with each winners comments about the charts at this link:
http://stockcharts.com/help/doku.php?id=support:contest01winners
(Most of the charts are too wide to include in this newsletter directly.)
We were absolutely amazed by the wide variation in charts that we received. It was great to see that people are really starting to use the new capabilities that SharpCharts2 brings to the table - overlays, colors, indicators of indicators, area fills, grid line options, annotations, custom panel heights, performance indicators, multiple symbols per chart, etc. Hopefully, these examples will inspire more people to get out and really explore the new things that SharpCharts2 can do.
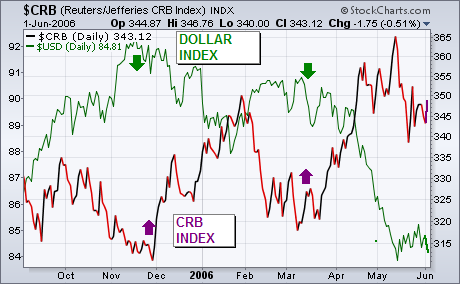
The chart below compares the Dollar Index (green line) to the CRB Index (purple line) since last September. The main message to be drawn from the chart is that the two markets have been trending in opposite directions which is their natural tendency. Dollar peaks last November and again in March coincided with CRB upturns. A dollar bounce during the first quarter coincided with a CRB selloff. The recent minor bounce in the dollar may have contributed to the recent slide in commodities. That's why commodity traders need to watch the dollar especially closely at this point. That's because the dollar is at a crucial chart juncture.
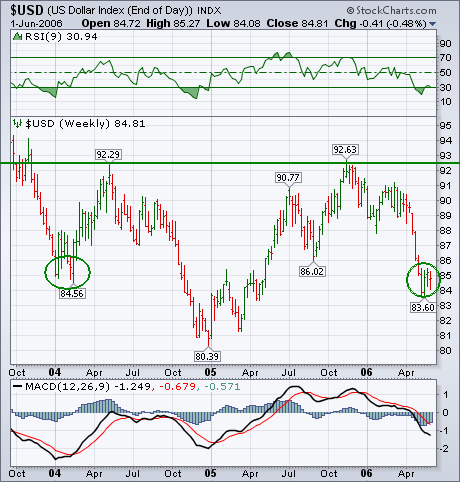
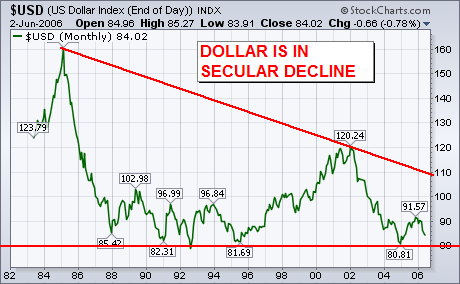
Back in March I wrote a column about a possible "head and shoulders" bottom being formed by the Dollar Index. The next chart is an updated look at that possible chart pattern. The horizontal line drawn over the 2005 peaks near 92 is a possible "neckline". The middle trough formed at the start of 2005 is a possible "head", while the early 2004 trough is a possible "left shoulder". If the current selloff is a "right shoulder", it shouldn't fall below the left shoulder. The two green circles show that level to be just above 84. The Dollar Index is testing that support level at the moment. To turn the chart pattern bullish, the USD would have to rally from this level and exceed its neckline at 92. It's a long way from doing that. If it doesn't hold near 84, it could drop all the way back to its early 2005 low near 80. Technical indicators are mixed. The 9-week RSI is in oversold territory under 30. But the weekly MACD lines are still negative. Since I'm a believer in the maxim that it's easier to continue a trend than to reverse one, I think odds favor a dollar move to the downside. That would be even more likely if today's weak jobs data encouraged to Fed to take a pause in June. That would be bullish for gold and other commodity markets. That's why a lot rides on the trend of the dollar. That's also why the final chart is so worrisome. Going back to the mid-1980's, it shows the dollar in a long-term secular decline. It also shows how important the support line is along the 80 level. It held at the start of 2005 and prevented a major breakdown. If the current level of 84 doesn't hold, that long-term support line at 80 will be threatened again.
The Dow came down hard in May, but found support at 11050. This support
level stems from January resistance and the April low. A key tenet of
technical analysis is that broken resistance turns into support. The Dow
broke above 11050 in February and this level turned into support in April
and May.
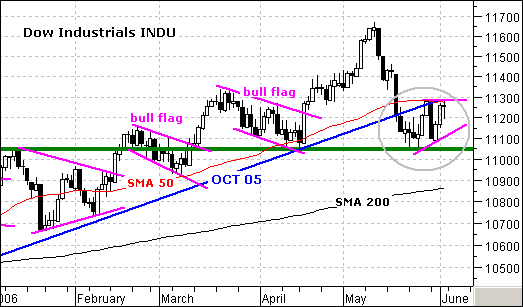
Since reaching support, the Dow consolidated over the last two weeks and a
pennant type consolidation is forming (gray oval). The sharp decline created
an oversold condition and the Dow needed to work off this condition. A two
week trading range is just the trick, but the pennant is a bearish
continuation pattern. A move below the May low would confirm the pennant and
call for a continuation of the May decline. The obvious target is the
200-day moving average around 10850. It is also worth noting that the Dow
was the only major index NOT to move back above its 26-May high on Thursday
and this shows relative weakness. The S&P 500, Russell 2000 and Nasdaq all
surged above their 26-May high on Thursday.
For a bullish resolution to this consolidation, I will be watching
resistance at 11300. This resistance level stems from the 50-day moving
average, the 26-May high and the October trendline extension. The October
trendline provided support until May and now acts as resistance. A break
back above 11300 is needed to put the Dow back into the bull mode.
On Tuesday we saw the market successfully retest last week's lows, then on Thursday there was a climactic rally that broke above last week's highs. This was a lot more positive than many people (including me) were expecting.
The most significant short-term event was that the CVI (Climactic Volume Indicator), which is the very nervous purple line on our first chart, hit its highest reading in over a year-and-a-half. This marked what I believe was an initiation climax (as opposed to an exhaustion climax). As the name implies, an initiation climax signals that a new short-term trend has been initiated in the direction of the climax, in this case up. Since the market is now short-term overbought, some backing and filling can take place before the up trend continues, but it is most likely that higher prices will be forthcoming.
What makes the recent bottom look pretty solid is that the other two indicators on the chart, the VTO (Volume Trend Oscillator) and STVO (ST Volume Oscillator), were very oversold at the recent price lows. I have circled other instances where both indicators were similarly and simultaneously oversold, and you can see that rallies of at least short-term duration resulted.
While this rally could challenge the May highs, I don't think it is the beginning of a major bull move because of our second chart below, which shows the percentage of stocks above their 20-, 50-, and 200-EMAs. As you can see, the shorter-term 20- and 50-EMA indicators reached oversold levels similar to other important bottoms in the last two years; however, the 200-EMA indicator was only modestly oversold at the recent price low. The bottom looks pretty solid but only for short-term purposes.

One thing to remember is that rallies out of oversold conditions are not a guaranteed sure thing. When the market turns bearish, oversold conditions are dangerous and can beget even more selling.
Bottom Line: Our primary medium-term timing model for the S&P 500 switched to neutral on May 19, which means that the decline was severe enough to trigger a caution flag. In order to return the model to a bullish stance, a modest amount of work will be required to the up side. The condition of the indicators says that is well within reach; however, I do not think this is the beginning of a major bull move, because the recent bottom was not deeply oversold on our long-term indicators.
The May Swoon as we are apt to call weakness seen during the month had led to an increase in confusion amongst technical analysts. However, we would argue that is all about "time horizons", and we should confuse short-term movements with long-term time horizons as we are beginning to see. In fact, our short-term indicators and models have traded to their lowest points in months; however our longer-term work has just begun to weaken. Everyone is conditioned to buy the dips, and those that haven?t have paid the price. Hence, we think the market is well seasoned for a larger sell-off from a longer-term perspective.
Let's keep it simple and take a long-term viewpoint; May's trade formed a bearish "key reversal" lower in many of the industrialized as well as emerging market indices (we have shown the S&P 500 as it is likely to outperform during any decline). Thus, if we use this bearish formation as our starting point ? the probability of a correction towards the rising major 40-month moving average support at 1145 has increased significantly. This would complete a normal -10% correction, and actually cause no harm to the bull market in stocks. However, if prices break through 1445, then a clear bear market will have begun.
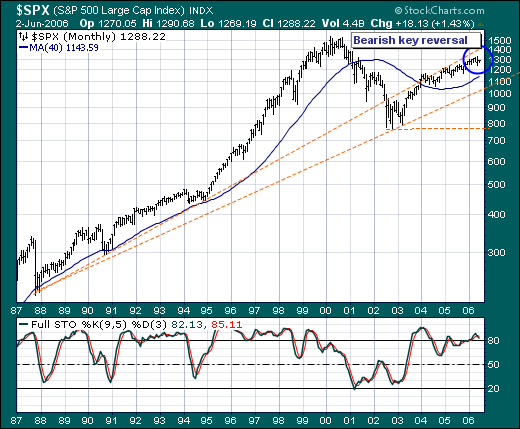
Therefore, from a tactical perspective - market strength such as that seen this week should be sold and/or sold short given the 40-month moving average target...allowing for a slight monthly rise. Our favorite market indices to short: short small and mid cap stocks as well as emerging market ETFs.


